A resource and community space for modern marketers, sellers, and builders using customer voice to grow — together.
This hub is built for anyone who wants to do more with the voices of their customers. Whether you're scaling advocacy, building trust with proof, or rethinking how to go to market — you're in the right place.
How-to guides and playbooks for building with customer voice
Campaign-ready templates and swipe files
Benchmark reports and reference best practices
Event recordings, expert sessions, and community spotlights
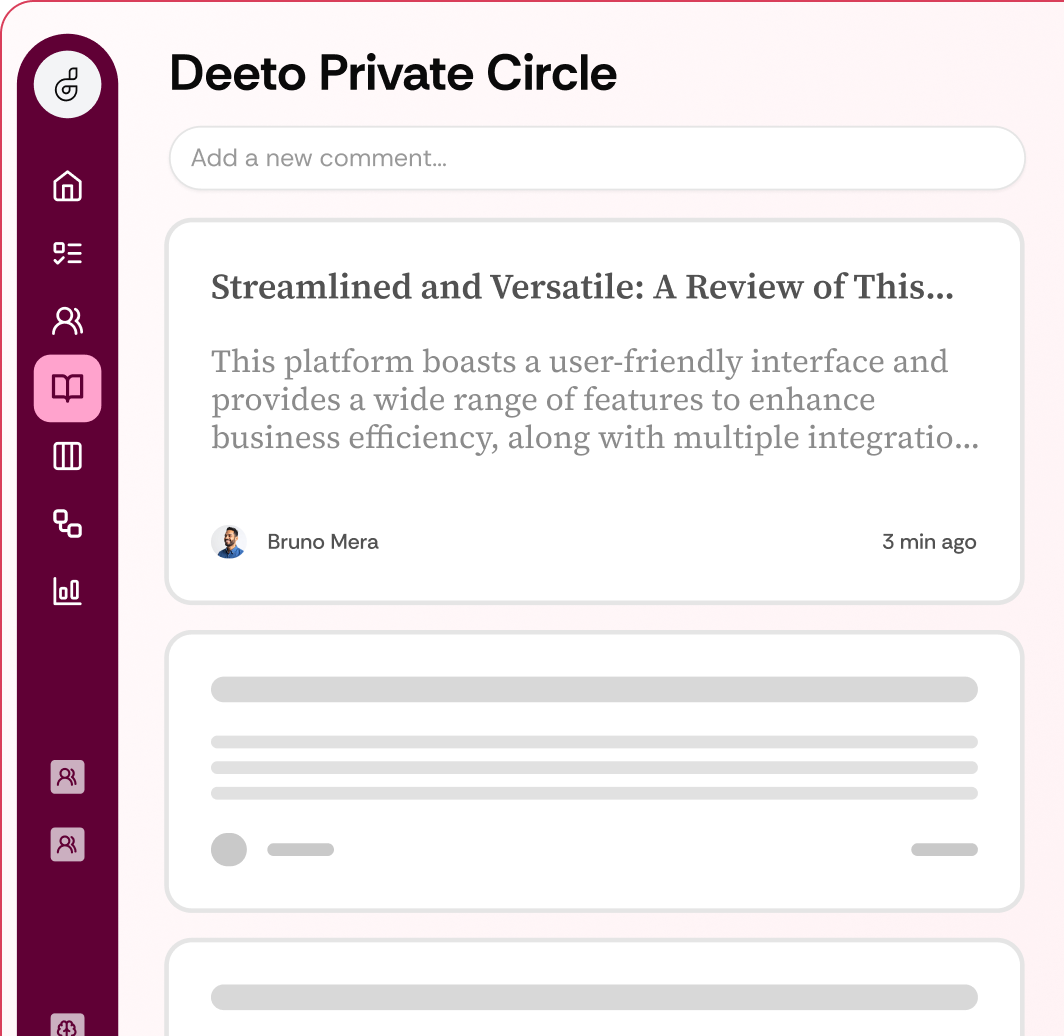
Ask questions. Share ideas. Trade wins. This is your space.
You don’t have to figure this out alone. The Deeto community connects you with other leaders using customer voice to build better GTM motions, faster-growing brands, and smarter strategies. If you are interested in joining when it launches, sign up below.
Automate advocacy management workflows
Dynamically generate customer stories and social proof
Eliminate manual reference management
Track and report advocacy impact on revenue
Discover practical guides, templates, and tools to help your team close more deals, faster.
Third-party verified customer references are customer testimonials, quotes, or proof points whose source has been authenticated by an independent organization rather than the vendor itself. Verification confirms that a real customer with a real experience produced the evidence rather than a marketing team that cleaned up an anecdote.
For B2B buyers evaluating software in 2026, this matters. G2 found that 84% of B2B buyers use third-party review sites to make purchase decisions. Buyer skepticism is rising alongside the volume of AI-generated content, and the demand for credible, traceable proof has followed.
This article covers what third-party verified customer references actually are, how verification works, what the data says about buyer trust, and where the field is heading as buyers want more than authentication. They want a name, a face, and a person willing to take a call.
Third-party verified customer references are customer proof assets where an independent party (not the vendor) has confirmed the identity of the respondent and the accuracy of the claims. The third party acts as an auditor of sorts, standing between the vendor and the buyer to ensure the evidence is credible.
Verification can cover several things:
The goal is to answer a buyer's baseline question: "Can I trust this?" Without third-party verification, even genuinely positive customer quotes carry the shadow of curation. Buyers know that vendors control their own marketing, and that awareness erodes confidence, especially late in an evaluation.
Third-party verified customer evidence is designed to close that gap. It signals to the buyer that someone outside the selling organization has checked the receipts.
Buyer trust has become a real variable in deal outcomes. Gartner research has found that buyers now spend only 17% of their total buying time meeting with potential vendors, with the rest spent on independent research, peer consultations, and internal discussion. Customer evidence is a critical asset in this environment, not a nice-to-have.
Buyer trust research points in a consistent direction: verification matters, but identity matters more. When a third party confirms that evidence is real, most of the trust gap closes even if the customer stays anonymous, but named proof goes further. A buyer reading a quote attributed to a real person at a real company can look that person up, cross-reference the claim, and decide whether the experience maps to theirs. That extra layer of accountability is what moves evidence from credible to convincing.
This holds especially true in industries like cybersecurity, financial services, and healthcare, where customers rarely go public. A "CISO at a Fortune 500 financial institution" quote that has been independently verified can move a deal forward in ways an unverified anonymous testimonial cannot. Verification gets the evidence through the door. A name and a face get it across the finish line.
Third-party verification solves the authenticity question. Named, video-verified customer references solve the conviction question.
There's a difference between a buyer trusting that a quote is real and a buyer trusting that the outcome described will apply to their situation. The second kind of trust, the kind that closes deals, comes from relevance and specificity. Knowing that a customer at an unnamed financial institution improved their pipeline velocity is a start, but buyers want to know who that customer is, what company they run, what their role was, and whether they'd take a call.
Named, on-camera references answer all of that. A buyer can look the person up, cross-reference the claim against what they know about the company, and judge whether the use case maps to theirs. Video goes even further because confidence, specificity, and authentic detail read differently on camera than in a polished quote. A customer who speaks for ninety seconds about a specific problem they solved is more persuasive than two cleaned-up sentences ever will be. And the most valuable form of all is a customer who will simply take a call; not a recorded asset, not a case study, but a live conversation where the prospect can ask whatever they actually want to know.
Reference management programs that surface willing, named, on-camera customers are the full expression of verified customer evidence.
Verification confirms that evidence is legitimate. It answers "is this real?" Named, video-verified customer references confirm that evidence is accountable. They answer "who said this, and can I talk to them?"
These are different buyer questions, and they come up at different points in a deal.
Verification matters early. When a buyer is forming an initial impression of a vendor, credibility signals like third-party authentication help the evidence register as trustworthy rather than spun. It moves customer proof out of the "marketing material" mental bucket and into something more like testimony.
Visibility matters late. When a buyer is building an internal business case or managing objections from a skeptical CFO or security team, anonymous proof, however verified, doesn't travel well. A named customer reference does. A prospect can say, "I spoke with the VP of Operations at [company name] who implemented this 18 months ago, and here's what they told me." That quote has a source. It has accountability.
Video testimonials deliver this accountability at scale. A customer speaking on camera, identified, confident in their recommendation, is a reference that can be deployed without scheduling a live call. It extends the reach of your best advocates without burning their time.
For product marketing and customer marketing teams, building a strong customer reference program means moving across a spectrum of evidence quality:
Verified anonymous proof is the foundation. It establishes credibility, works well for regulated industries, and can be collected at scale. Every evidence library should have it.
Named written proof raises specificity. A quote attributed to a real person at a real company is more portable than an anonymous one. It performs better in sales decks, competitive battlecards, and one-pagers.
Named video proof adds accountability. An on-camera customer isn't just a credible source, they're a visible advocate. Buyers can see their conviction. The evidence doesn't require interpretation.
Live on-camera references close deals. A customer willing to take a call from a prospective buyer is the highest form of customer evidence. They carry the full weight of personal testimony, peer-to-peer trust, and specificity that no asset can replicate.
A well-run customer advocacy program moves customers through this spectrum, not just into it. The goal isn't only to collect proof but to develop advocates willing to stand behind it.
Most companies have some customer evidence. Fewer have a system for producing the kind of named, on-camera, willing-to-talk references that shorten deals. The gap is usually process, not intent.
Here's what a functioning program looks like:
1. Collect evidence with consent and context. Customer feedback captured through structured interviews or surveys with clear permissions tracking is easier to activate as named proof. Customers who understand how their input will be used are more likely to approve on-camera or named use. Deeto's Listen module captures this voice continuously across touchpoints.
2. Organize by segment and use case, not just sentiment. A "great product!" quote is hard to deploy. A "we reduced our onboarding time by 40% across a 200-person field team" quote is deployable in a dozen contexts. The reference library should index evidence by industry, role, company size, product area, and outcome so that sales can surface the right proof in seconds.
3. Identify and develop willing references. The customers who left the strongest evidence are your reference candidates. A systematic outreach process, one that respects their time and gives them control over how they participate, produces more willing on-camera references than ad hoc asks. Deeto's Activate module surfaces the right advocates at the right moment in a deal.
4. Make references self-serve for sales. The fastest way to exhaust your best customers is to route every reference request through a manual process. A searchable reference library that sales can access directly, filtered by the buyer's exact profile, puts the right proof in the right hands without bottlenecks.
This is the system described in Deeto's guide to building a customer reference program, and it's the difference between a proof library and a competitive advantage.
Yes. Deeto integrates natively with G2, one of the most widely used third-party software review platforms for B2B buyers. This means customers who use both platforms can pull G2's independently verified reviews directly into Deeto's content library, microsites, and sales enablement workflows. Verified reviews become activatable proof assets alongside video testimonials, reference calls, and case studies, all in one place.
Deeto's own customers have also left verified reviews on G2 directly. As of 2026, Deeto holds a 4.8 out of 5 rating, with reviews authenticated through G2's verification process, which confirms reviewers are real users of the software. Customers like Karilla D., a Senior Customer Advocacy Manager at a mid-market company, have written on record that Deeto freed up their time by letting sellers self-serve reference calls without going through the advocacy team. That review is named, attributed, and independently hosted.
For buyers who want to read Deeto customer reviews directly, the G2 profile is publicly accessible and sourced entirely from real users.
Third-party verification is a necessary foundation for buyer-grade customer evidence. It answers the question buyers have always had: "Can I trust this?" And when done well, the answer it gives is credible.
But the next question buyers are asking is different. It's not about authenticity, it's about accountability. Named, on-camera, willing-to-talk customer references give buyers someone to point to, someone to call, someone who put their professional name behind a recommendation.
Deeto is built to produce that level of evidence, from capturing authentic customer voice to organizing it by segment and use case to activating it in the exact moment a deal needs it. If you want to see how the platform builds a customer reference engine built on visibility, not just verification, book a demo.
What is a third-party verified customer reference?
A third-party verified customer reference is a testimonial, quote, or proof point that has been authenticated by an independent organization, not the vendor. The third party confirms that the respondent is a real customer and that the evidence accurately represents their experience. This gives buyers confidence that the proof is credible rather than curated or fabricated.
How is blind-but-verified customer evidence different from named customer proof?
Blind-but-verified evidence means the third party has confirmed the customer's identity, but the customer remains anonymous to buyers. Named customer proof means the customer is fully identified by name, title, and company. Both formats carry more weight than unverified anonymous quotes, but named proof travels further. It is more portable in internal business cases, easier for a skeptical stakeholder to validate independently, and stronger late in deals when a buyer needs to build a justified case for purchase.
Why do video-verified customer references matter more than written testimonials?
Video-verified customer references allow buyers to see and hear a peer speak about their experience. This format conveys conviction, specificity, and credibility in ways text cannot. On-camera references also signal that a customer is accountable for their recommendation, which carries more weight than an anonymous or byline-only quote. For enterprise deals where stakeholders need to justify a decision internally, named video proof is often the strongest asset available.
What makes a customer willing to be an on-camera reference?
Customers are most likely to participate as named references when the relationship is strong, the ask is clear, and the process is low-friction. Companies that systematically track customer satisfaction, flag high-sentiment customers early, and make it easy to participate in a short recorded conversation produce more willing references than those who ask ad hoc. Programs that respect the customer's time and give them control over how their reference is used sustain advocate engagement over time.
How do you build a scalable named customer reference program?
A scalable customer reference program needs four things: a system for capturing customer feedback with clear consent and use-case context; an organized library indexed by segment, industry, and outcome; a process for identifying and activating willing reference customers; and self-serve access for sales so references are available in seconds, not days. Platforms like Deeto automate the capture, organization, and activation layers so the program runs continuously rather than as a campaign.
What is the difference between a customer reference and a case study?
A case study is a long-form, vendor-produced narrative about a customer's experience, typically published as a PDF or web page. A customer reference is a direct connection to a customer who can speak to their experience through a recorded video, a written quote, or a live conversation. References are more flexible to deploy and more persuasive in late-stage deals because they're in the customer's own voice and can be directed at specific buyer questions.

What are third-party verified customer references? Learn what they are, why verification matters, and more.
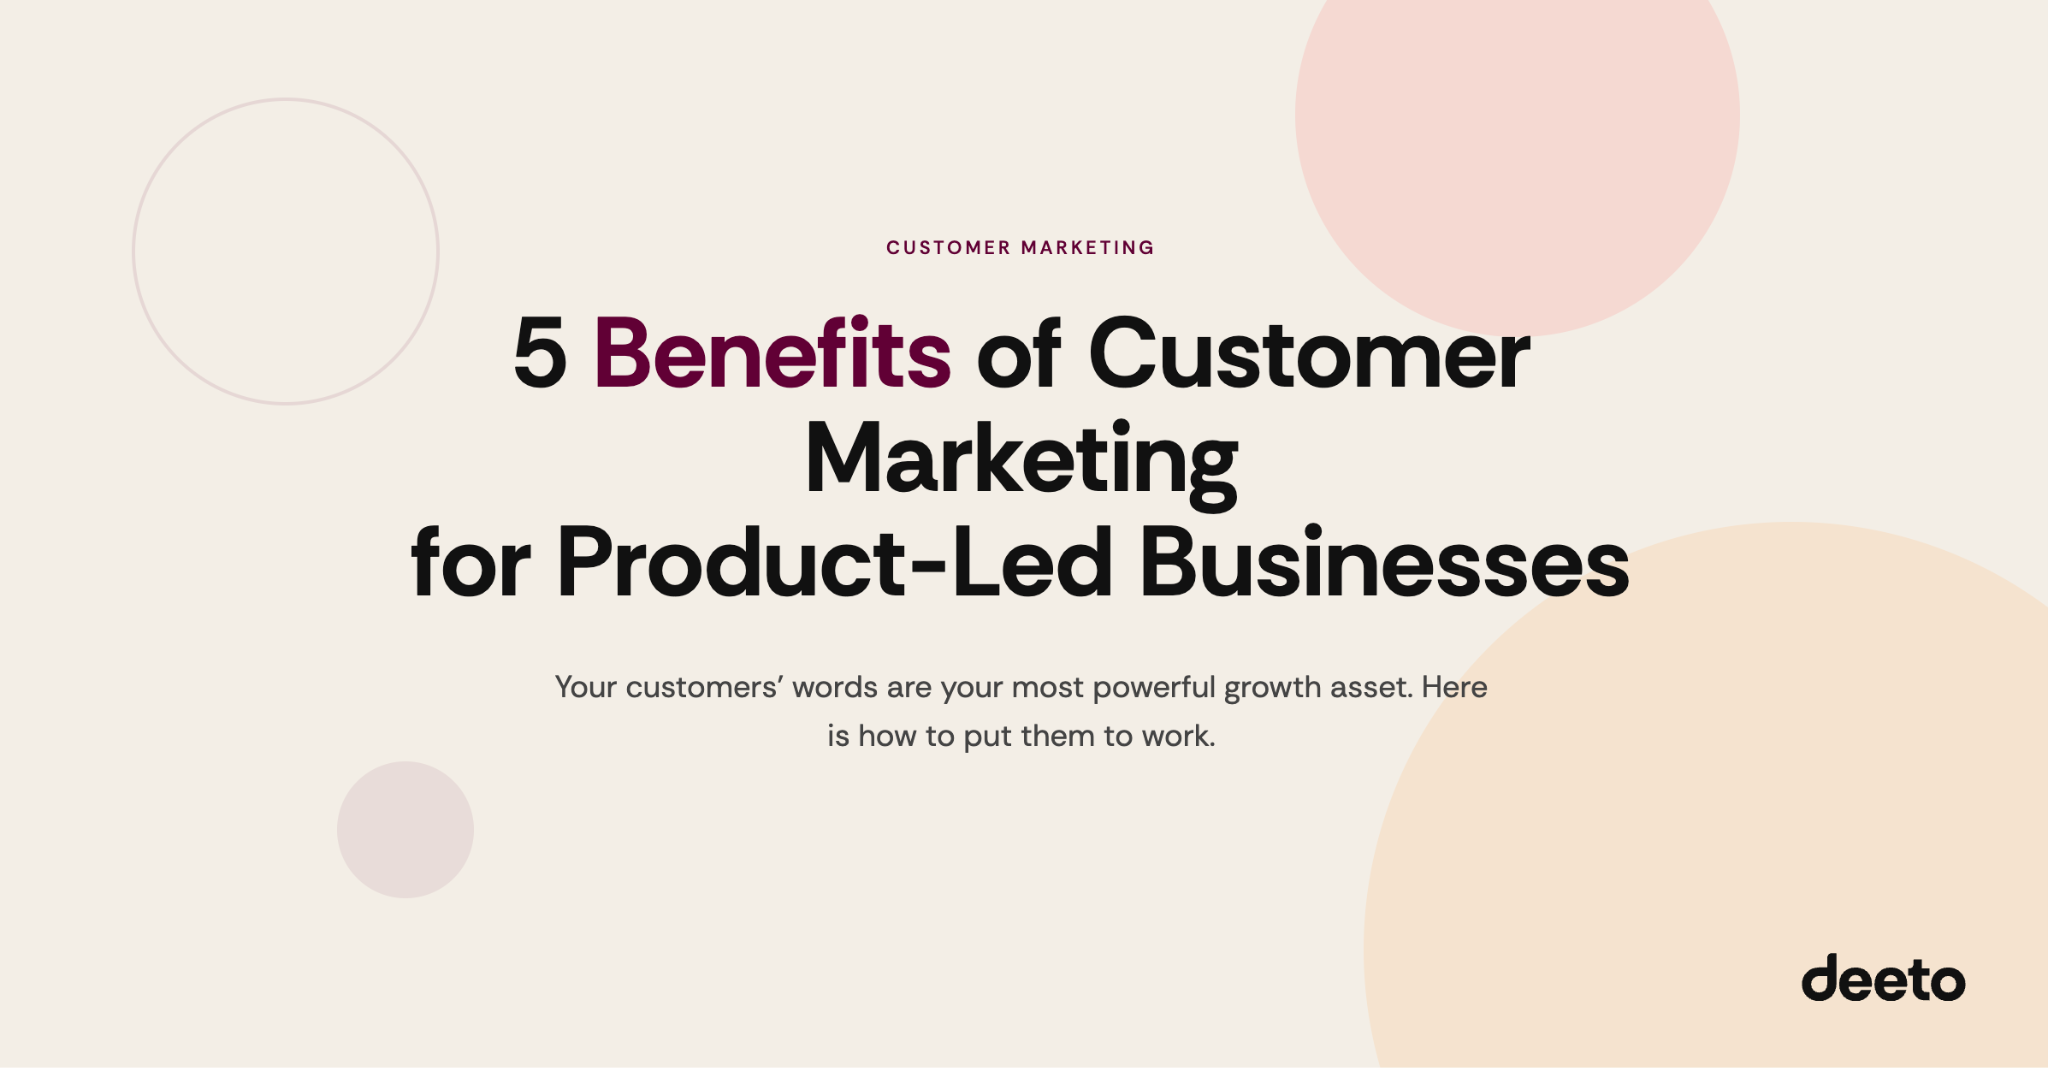
Most B2B buyers read reviews before they take a sales call. They trust a peer's words over a vendor's claim. That is the core insight behind customer marketing, and it is why product-led businesses treat it as a growth engine, not just a nice-to-have.
Customer marketing is the practice of turning your existing customers' voices into A developer who talks publicly. The benefits extend well beyond social proof: when done right, customer marketing drives product improvement, accelerates sales cycles, and gives product-led teams a repeatable system for growth. This post breaks down five of those benefits and explains how to put them to work.
Customer marketing uses the voice of existing customers to support acquisition, retention, and expansion. It includes testimonials, case studies, ROI data, advocacy programs, reference management, and voice-of-customer research.
For product-led businesses, it is especially powerful. When your product is the primary driver of growth, your customers' experiences are your most credible proof. Customer marketing systems help teams collect, organize, and activate that proof at scale, turning individual customer stories into a connected intelligence asset that works across sales, marketing, and product.
Customer marketing is frequently confused with customer success and customer experience. All three functions orbit the same customer relationship, but they have different goals, different outputs, and different owners. Blurring the lines between these is one of the most common reasons customer marketing never gets the dedicated investment it deserves.
Product-led growth (PLG) businesses rely on the product to acquire and expand users, but the product cannot do everything alone. Buyers still need proof that it works before they commit, especially at larger deal sizes or in competitive markets.
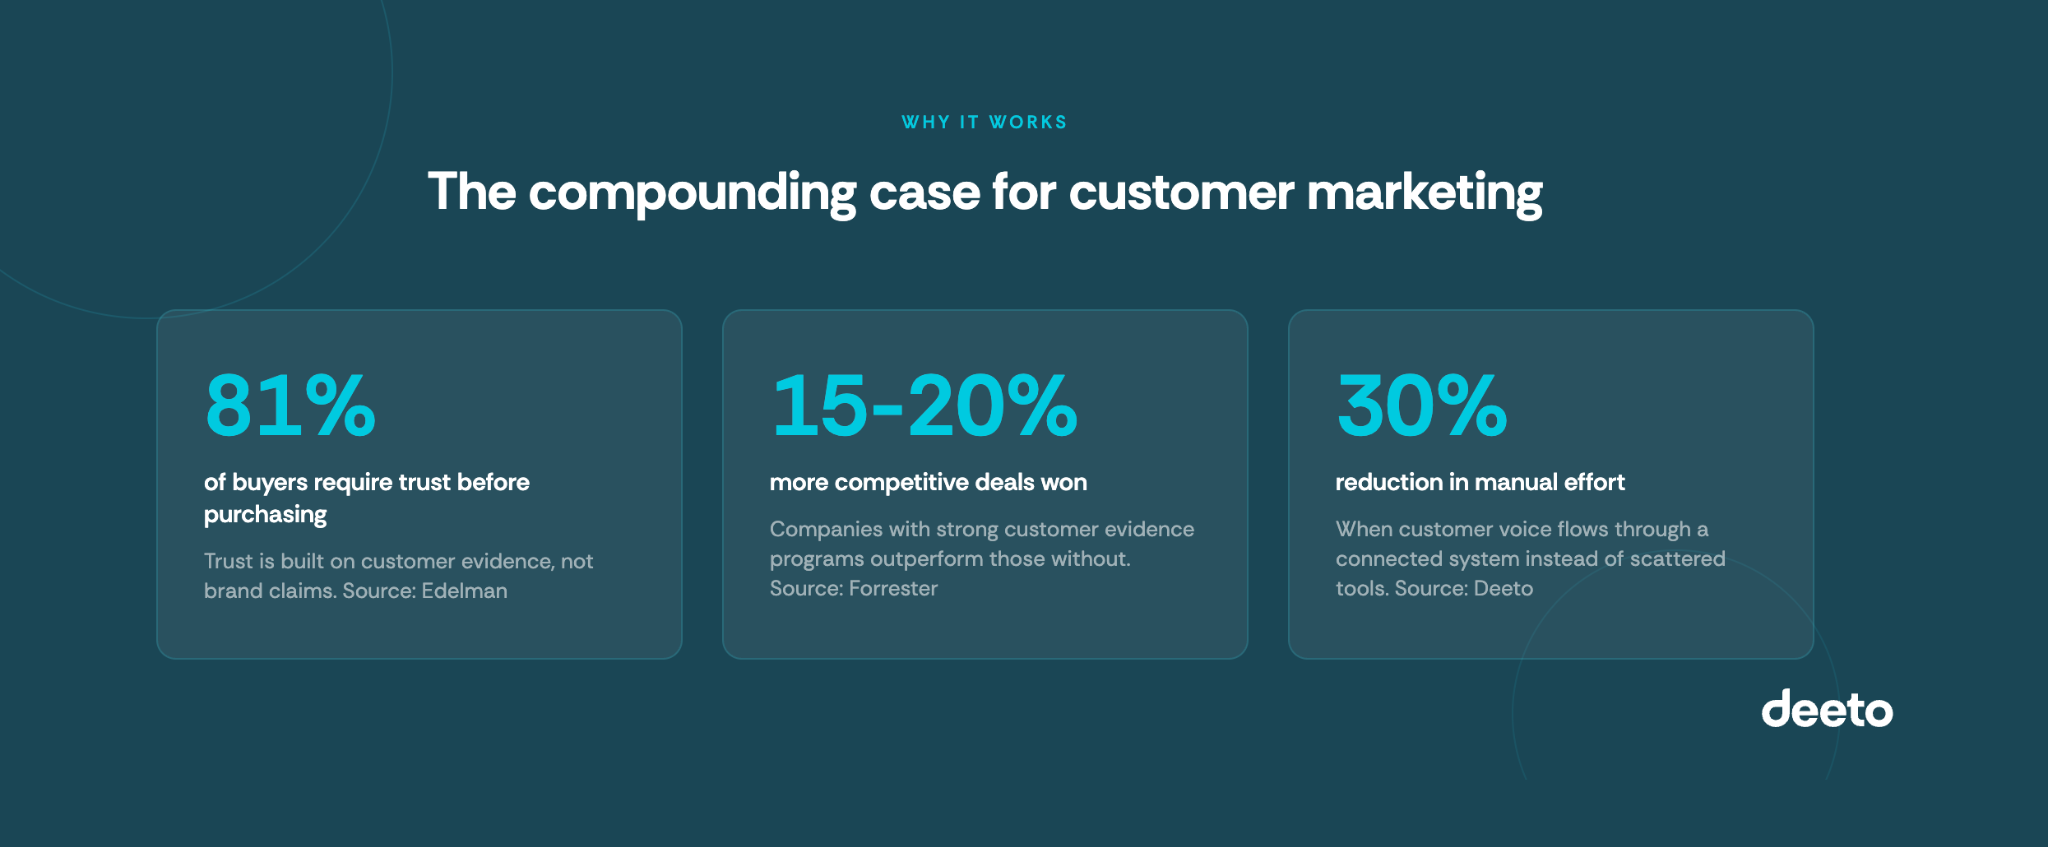
Customer marketing fills that gap. It provides the evidence layer that makes product-led motions more convincing. A well-run program gives sales teams real proof for competitive deals, gives product teams validated feedback, and gives marketing teams authentic content that outperforms anything produced in-house. Trust is built on evidence, not claims. That is exactly why the companies growing fastest in PLG are the ones with the best customer marketing infrastructure behind them.
Customer marketing is one of the most efficient sources of structured product intelligence for a product-led team. When your programs systematically collect feedback through surveys, interviews, advocacy interactions, and post-implementation check-ins, you build a data set product teams can actually use.
This is different from reactive feedback. Support tickets and Slack messages tell you what went wrong. A structured customer marketing program tells you what customers value most, which features drive retention, where onboarding breaks down, and what would make them renew without hesitation.
5 benefits of customer marketing for product-led businesses
Deeto's Listen module is built for exactly this, capturing authentic customer voice continuously so product teams have a real-time signal, not just an annual survey.
One of the most direct benefits of customer marketing is the proof it creates for sales. Testimonials, case studies, ROI data, and verified outcomes give sales reps something buyers actually trust.
Peer influence is not a soft variable in B2B buying. Buyers consult review sites, ask their networks, and look for proof that a product works in their specific context: their industry, their team size, their use case. If you cannot provide that proof when they go looking for it, you lose ground to competitors who can.
A customer proof library does not just help close new deals. It supports competitive displacement, accelerates deals in new verticals, and gives demand generation teams content that converts at a higher rate than anything written without a customer voice behind it.
Deeto's Stories and Social Proof use case collects, organizes, and activates this content across the full go-to-market motion, so the right proof reaches the right buyer at the right moment.
Customer marketing is not only outward-facing. The programs you run to collect stories, conduct advocacy interviews, and gather feedback create a loop that customers notice. Being asked for their perspective, having their input shape the product, seeing their story used with care: these things build loyalty.
Retention is one of the most undervalued benefits of customer marketing. It is not just a renewals motion. It is what happens when customers feel connected to the company they chose, when they can see their feedback made a difference, and when they are treated as partners rather than data points.
For product-led businesses, this matters especially. When the product is the relationship, the moments between product interactions are where loyalty is either reinforced or lost. Customer marketing fills those gaps with intention.
Deeto's customer experience and value realization programs make customers feel heard at every lifecycle stage, not just when they are about to churn.
Entering a new vertical or geography is one of the hardest things a product-led business does. You do not have the reference customers, the brand recognition, or the proof stories buyers in that market expect to see.
Deeto’s Listen module is built for exactly this
This compounds over time. The more diverse your customer base, the broader your proof library, and the faster you can credibly enter adjacent segments. According to TrustRadius's 2024 B2B Buying Disconnect Report, 56% of buyers had conversations with a product user before purchasing and that number rises to 71% for enterprise purchases. That gap exists because most teams collect customer stories reactively. The ones who build a system get the compounding advantage.
Win-loss analysis pairs well here. Understanding why you win in some markets and lose in others tells you exactly where to focus your customer marketing resources.
The most advanced benefit of customer marketing is advocacy: turning satisfied customers into active participants in your growth. Advocates refer new business, join advisory boards, speak at events, write reviews, and take reference calls. Done well, advocacy becomes a channel in its own right.
For product-led businesses, advocates are particularly valuable because their credibility comes from direct product experience. According to TrustRadius That kind of proof is impossible to manufacture and hard for competitors to copy.
Advocacy programs build slowly and pay off for years. The key is a system that identifies potential advocates early, makes participation easy, and rewards engagement in ways that feel genuine rather than transactional.
Deeto's customer advocacy and reference management capabilities make advocacy a managed, measurable motion, not a side project owned by one person on the CS team.
Getting started does not require a large team or a complex program. Most product-led businesses begin with three things:
The mistake most teams make is treating these as separate workstreams owned by different teams. Customer marketing works best when it connects customer success, product marketing, and sales enablement into a single system, one where every customer interaction generates intelligence and every piece of intelligence can be activated.
That is what customer marketing teams use Deeto for: a platform that connects listening, learning, and activation so the customer voice flows from conversation to decision without friction.
What is customer marketing?
Customer marketing uses the voice, feedback, and success stories of existing customers to support acquisition, retention, and expansion. It includes testimonials, case studies, advocacy programs, and voice-of-customer research. For product-led businesses, it is how the product's real-world impact becomes a marketing asset.
What are the main benefits of customer marketing?
The main benefits include continuous product feedback, a scalable proof library for sales, stronger customer retention, faster entry into new markets, and a managed customer advocacy channel. Each compounds over time when supported by a consistent program and the right technology.
Why is customer marketing important for product-led businesses?
Product-led businesses rely on their product to drive growth, but buyers still need proof that it delivers results. Customer marketing provides the evidence layer: verified stories, outcome data, and peer-to-peer proof that fills the trust gap between product experience and purchase decision.
How does customer marketing improve customer retention?
Customer marketing improves retention by creating structured feedback loops that make customers feel heard. When customers see their input reflected in the product, and when their stories are used with care, they feel more connected to the company. That connection strengthens loyalty before the renewal conversation begins.
What is the difference between customer marketing and customer success?
Customer success focuses on helping customers achieve outcomes with the product, covering onboarding, adoption, and health management. Customer marketing converts those outcomes into proof, advocacy, and growth assets. The two work best when connected. Customer success identifies the stories, and customer marketing activates them.
How do you build a customer marketing program?
Start with a listening system to collect structured feedback, build a proof library to store and activate customer stories, and create a lightweight advocacy track to identify and engage potential advocates. The goal is connecting these three motions into one system so customer intelligence flows continuously from collection to activation.

Learn how product-led businesses use customer voice to grow faster, retain more, and win new markets.
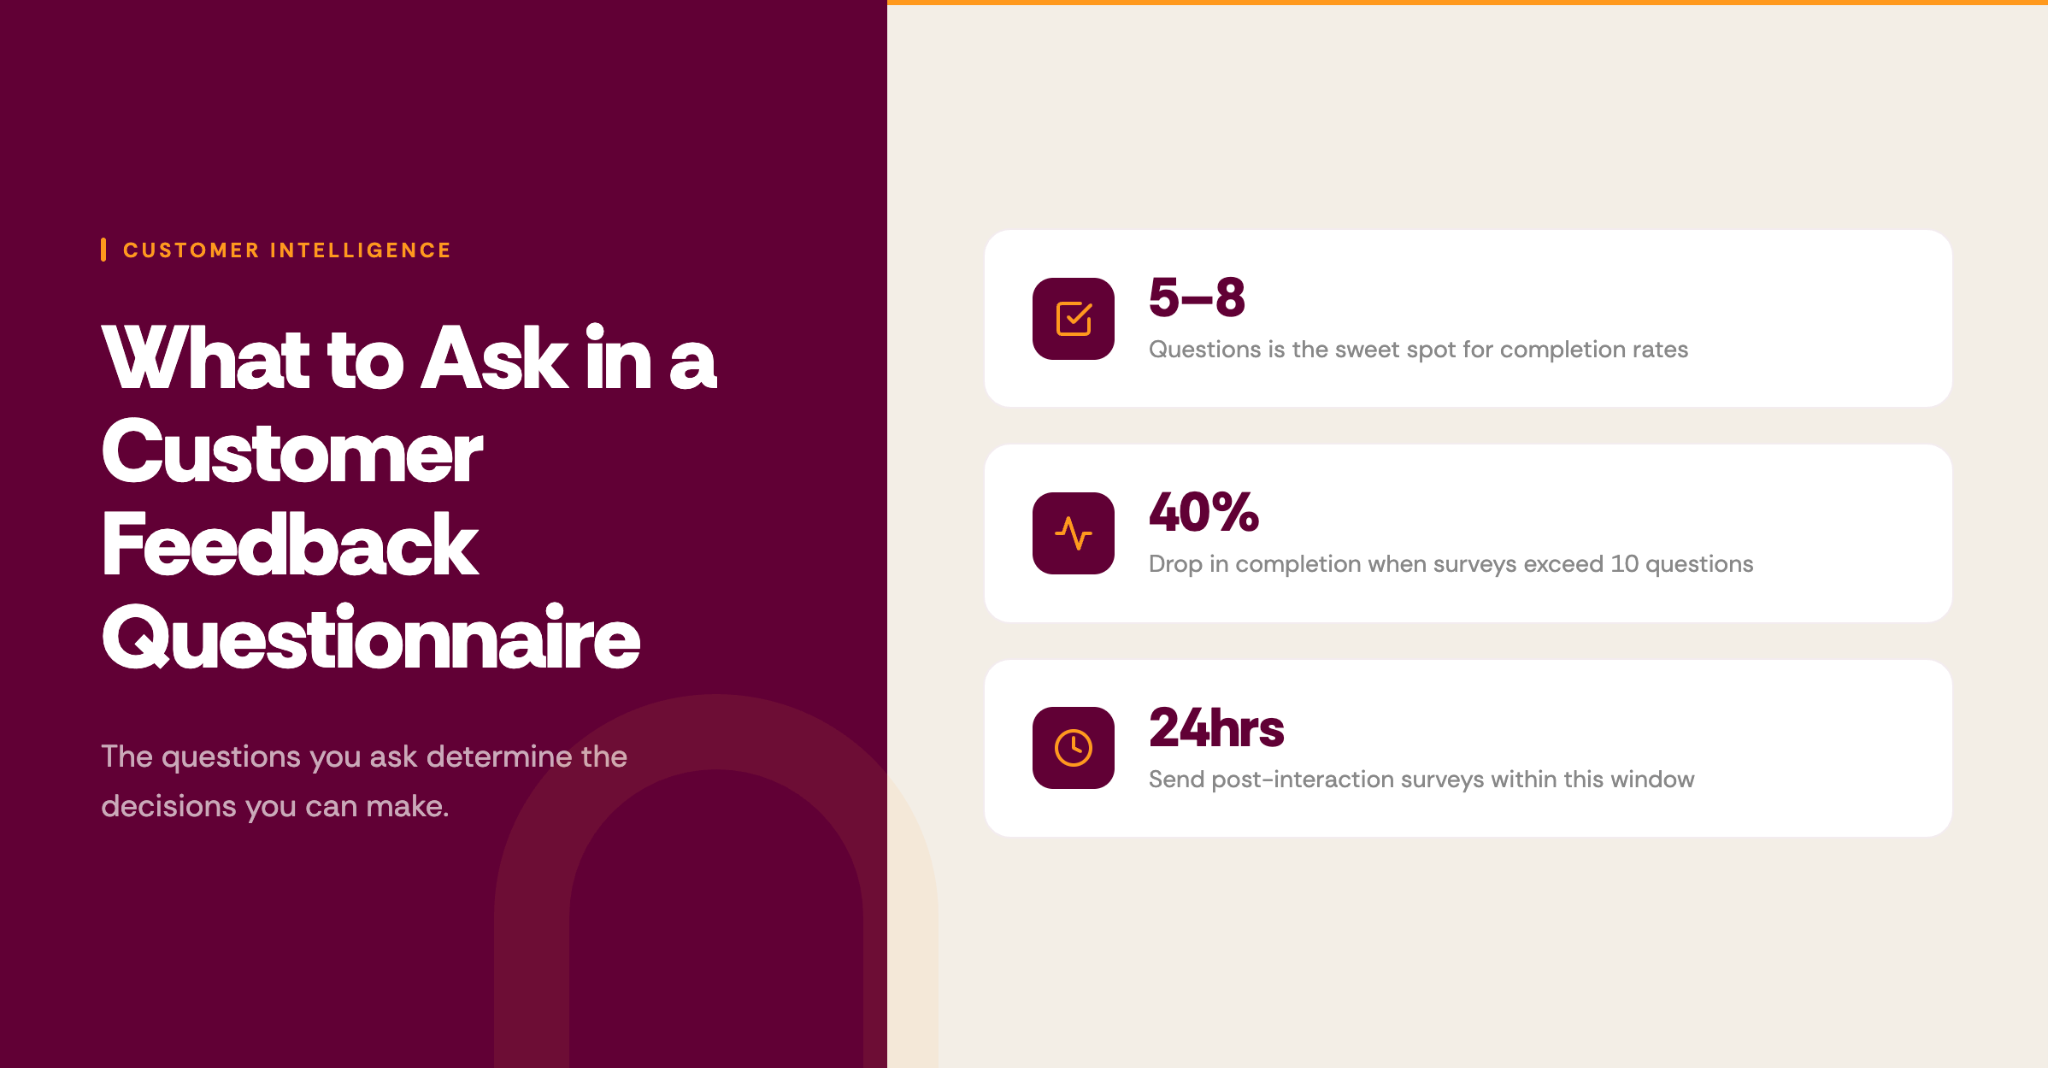
A customer feedback questionnaire is a structured set of questions sent to customers to understand their experiences and needs. Done right, it gives companies a direct line to what's working and where the real risks live. Done wrong, it's a five-minute form with ten checkbox questions and an NPS score that gets exported to a spreadsheet, summarized in a quarterly deck, and ignored until next quarter.
This article covers what to ask, why most feedback strategies miss the mark, and how to design questions that produce insight your team can actually use.
A customer feedback questionnaire is a tool companies use to gather structured input directly from customers. It can take the form of a post-onboarding survey, a quarterly check-in, a product feedback form, or an exit interview. The goal: understand what customers think and need.
These questionnaires help teams across the organization. Customer success uses them to spot churn risk early. Product uses them to prioritize the roadmap. Marketing sharpens messaging from them. Sales uses the outputs to build credibility with prospects.
The problem isn't volume. Most companies collect plenty of feedback. The challenge is that what they collect is too generic to share, act on, or build from.
Most companies have more feedback than they know what to do with. The gap between teams that grow from it and those that don't isn't about how much they collect, it's about whether the questions are specific enough to produce insight anyone can use.
Static questionnaires ask every customer the same thing. A startup that just completed onboarding gets the same questions as an enterprise customer renewing their third contract. A churned customer gets the same form as a brand advocate. The result is data that averages everything and explains nothing.
A questionnaire that actually drives decisions asks questions relevant to where the customer is in their lifecycle, and is specific enough to their experience that they actually want to answer. Picking five questions from a generic list gets you none of that.
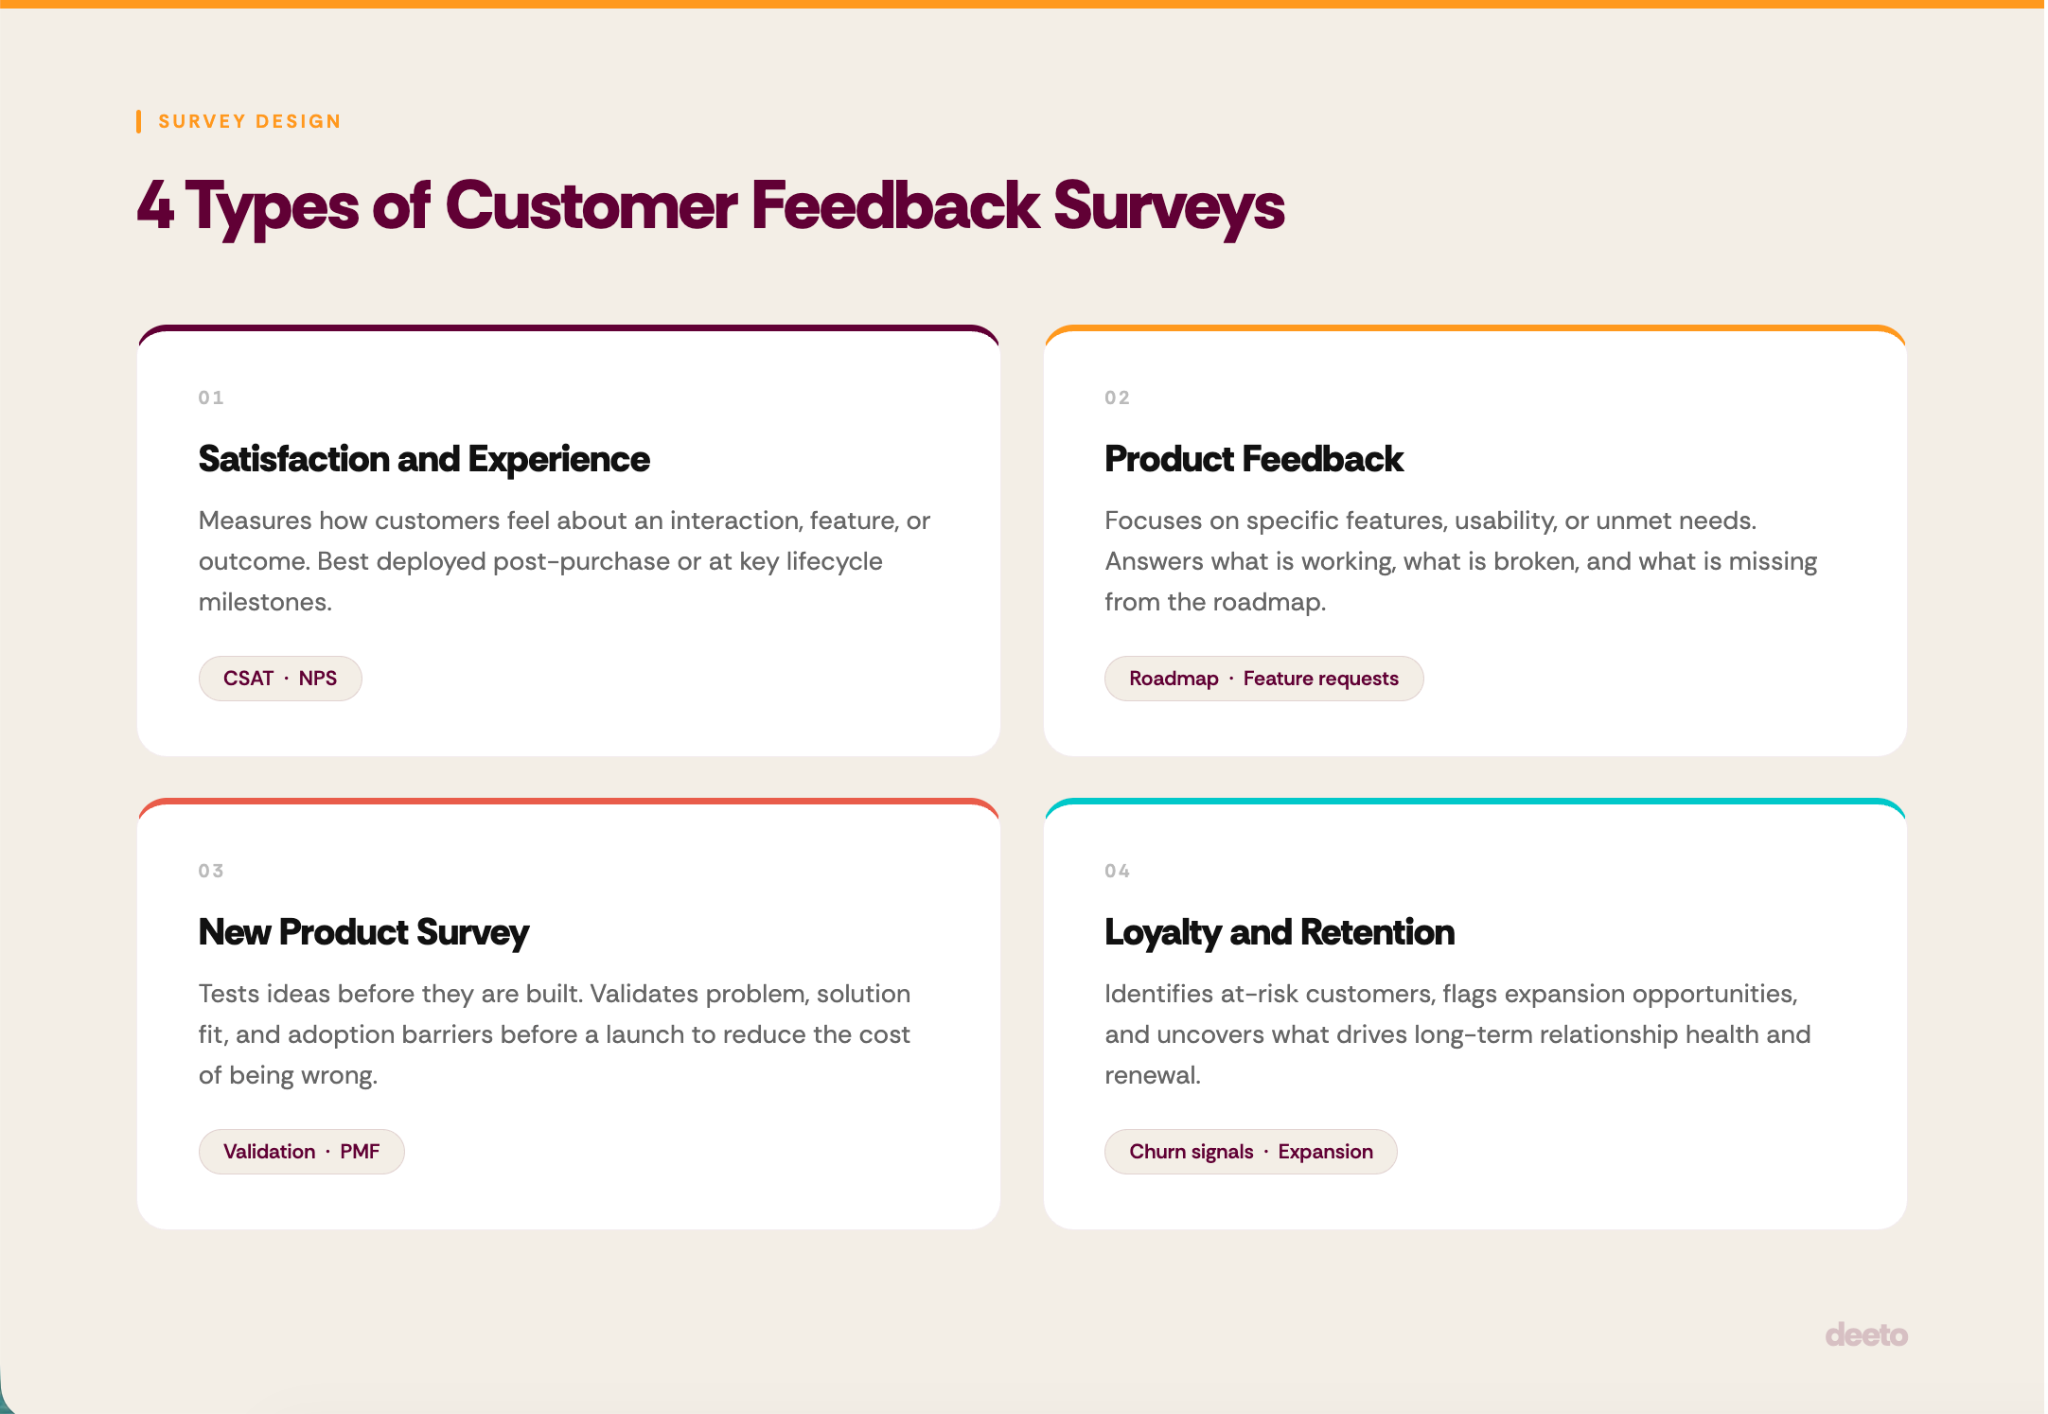
Not all surveys serve the same purpose. Before writing a single question, decide which of these four categories your questionnaire belongs to.
Each category calls for different questions. A retention survey should not look like an NPS survey. Know your goal before you write the first line.
These are the most effective questions across the core survey types. Use them as a starting framework, not a copy-paste script. Adapt the language to match your product, your customer, and the specific moment in the journey.
The last question is underused and often the most useful. It forces specificity without anchoring the customer to your assumptions.
The comparison question is powerful if you are trying to sharpen competitive positioning. Pair the answers with your win/loss analysis data to get the full picture.
A new product survey is best run before development starts or immediately after beta access. The goal is to validate whether the problem is real, whether your solution fits, and whether the customer would actually pay for it.
That last question is the one most teams skip. It is also the one most likely to surface the real objection before it kills your launch.
Post-support surveys should be sent within 24 hours of the interaction. Response rates drop sharply after 48 hours.
Customer sentiment analysis at scale starts with questions like these, but the real value comes from identifying patterns across hundreds of responses, not reading individual ones.
Typeform and SurveyMonkey are easy to set up and work fine for simple, one-time surveys. They're not designed for ongoing feedback loops or for connecting responses to customer context in your CRM.
Medallia and Qualtrics are enterprise-grade VoC platforms with strong analytics. They're powerful and expensive, require significant implementation work, and still rely on static templates you customize yourself.
Intercom and HubSpot have lightweight survey functionality built in, which works well for embedding a quick question in a product flow or email. Not built for depth.
Deeto works differently. Instead of sending customers a fixed questionnaire, Deeto's Listen module generates question sets tailored to each customer's profile, journey stage, and what your team needs to know right now. A customer in month two of onboarding gets different questions than one approaching renewal. The result is feedback that reflects where the relationship actually is, not a template designed for a customer that doesn't exist.
Static questionnaires are built for average customers, and your customers aren't average.
They're in different industries, at different stages of their relationship with you, running different workflows, sitting on different risks. A question like "How satisfied are you with our product?" means something completely different to a customer in month one than to one in year three.
Generic questions flatten all of that into a single number. They tell you satisfaction is trending at 7.4 this quarter. They don't tell you why your mid-market segment is at 6.1, which features your enterprise accounts still aren't using, or why three of your healthiest accounts haven't responded to anything in 60 days.
Feedback designed for a specific customer has to account for their industry, their lifecycle stage, their product usage, and what your CS or sales team already knows about them. This is why customer sentiment analysis built on checkbox surveys tends to underperform; the inputs aren't rich enough to produce useful outputs.
Deeto solves this by generating unique question sets for each customer rather than defaulting to a static form. The platform knows what stage the customer is in, what signals have come in from previous interactions, and what your team needs to understand right now. What you get back is feedback specific to that customer's situation, and that specificity is what makes feedback worth collecting in the first place.
Collecting feedback is the easy part. Acting on it is where most programs break down.
Aggregate before you react. One strong opinion is not a signal. Ten customers saying the same thing is. Wait for pattern, not anecdote, before changing anything.
Tag responses to decisions. Before you send a survey, name the decision it is designed to inform. When responses come in, route them to that decision owner. Feedback that goes into a spreadsheet and stops there is not feedback. It is noise.
Close the loop with respondents. If a customer took five minutes to tell you what is broken, they deserve to know what happened next. Even a one-line follow-up builds more trust than any NPS score you could generate.
Connect feedback to other signals. Survey data is most powerful when it sits alongside your internal product and support data. The customer research use case in Deeto connects survey responses to the broader customer intelligence picture so nothing lives in a silo.
If you are also using feedback to inform your content or messaging strategy, Deeto's product marketing team solution helps PMMs connect what customers actually say to the claims they make in the market.
A customer feedback questionnaire's value depends entirely on whether questions are relevant to the individual customer's experience. The most useful questions ask about outcomes, product gaps, future priorities, and loyalty rather than general satisfaction.
Timing matters: feedback collected at the right journey moment produces far richer responses than periodic mass surveys. Generic, static questionnaires produce generic insight.
Most feedback programs are really data collection programs. They generate exports, dashboards, and quarterly trend lines. Clear, specific insight tied to individual customer relationships is what they rarely produce.
The right starting point is making your questions relevant enough that customers want to answer them. That means getting specific to the customer's lifecycle stage, their product usage, their business goals, and what your team actually needs to understand.
If you want to see how Deeto helps teams move from static feedback forms to dynamic customer intelligence, book a demo.
What is a customer feedback questionnaire?
A customer feedback questionnaire is a structured set of questions sent to customers to collect input about their experience, satisfaction, product usage, or future needs. It can be delivered via email, in-product, or through a dedicated survey tool. The goal is to surface insight that helps teams across customer success, product, marketing, and sales make better decisions.
What questions should I ask in a customer feedback survey?
The best questions depend on where the customer is in their journey. Key categories include: overall experience and satisfaction, product value and feature usage, support quality, likelihood to recommend or advocate, and future business priorities. Open-ended questions generally produce more specific and usable insight than scale-based ratings alone.
How long should a customer feedback questionnaire be?
Aim for five to eight focused questions per questionnaire. Shorter surveys get higher response rates and more honest answers. Twenty-question forms get rushed responses or no responses at all. Prioritize depth over breadth.
How is a feedback questionnaire different from a static survey?
A static survey sends every customer the same questions regardless of their context. A feedback questionnaire, when designed well, is tailored to the individual customer's lifecycle stage, product usage, and relationship history. The more relevant the questions, the more useful the answers.
Why do customers stop responding to feedback requests?
Usually because nothing appears to change after they respond. Closing the loop, even with a simple acknowledgment, dramatically improves future participation. Customers also disengage when questions feel irrelevant to their actual experience, which is why personalization matters.
How does Deeto approach customer feedback questionnaires differently?
Deeto generates dynamic, AI-driven question sets tailored to each customer rather than using a fixed template. The platform accounts for the customer's journey stage, previous interactions, and what the team needs to understand at that moment. This means every customer gets questions that reflect their specific situation, producing feedback that's richer and more specific than a standard survey.

Learn the right questions to ask, common mistakes to avoid, and why personalized questions outperform static surveys.
If you've spent any time in B2B sales, you've heard "SDR" and "BDR" used like they mean the same thing. They don't — and the confusion tends to show up in the worst possible place: a hiring decision.
An SDR (Sales Development Representative) qualifies inbound leads from marketing. A BDR (Business Development Representative) generates new pipeline through outbound prospecting. The distinction is direction: inbound vs. outbound. Get that wrong and you end up with pipeline gaps, rep confusion, and a headcount that doesn't fix the actual problem.
This guide covers what each role does, how compensation and KPIs differ, where the two roles overlap, and how to figure out which one your team needs first.
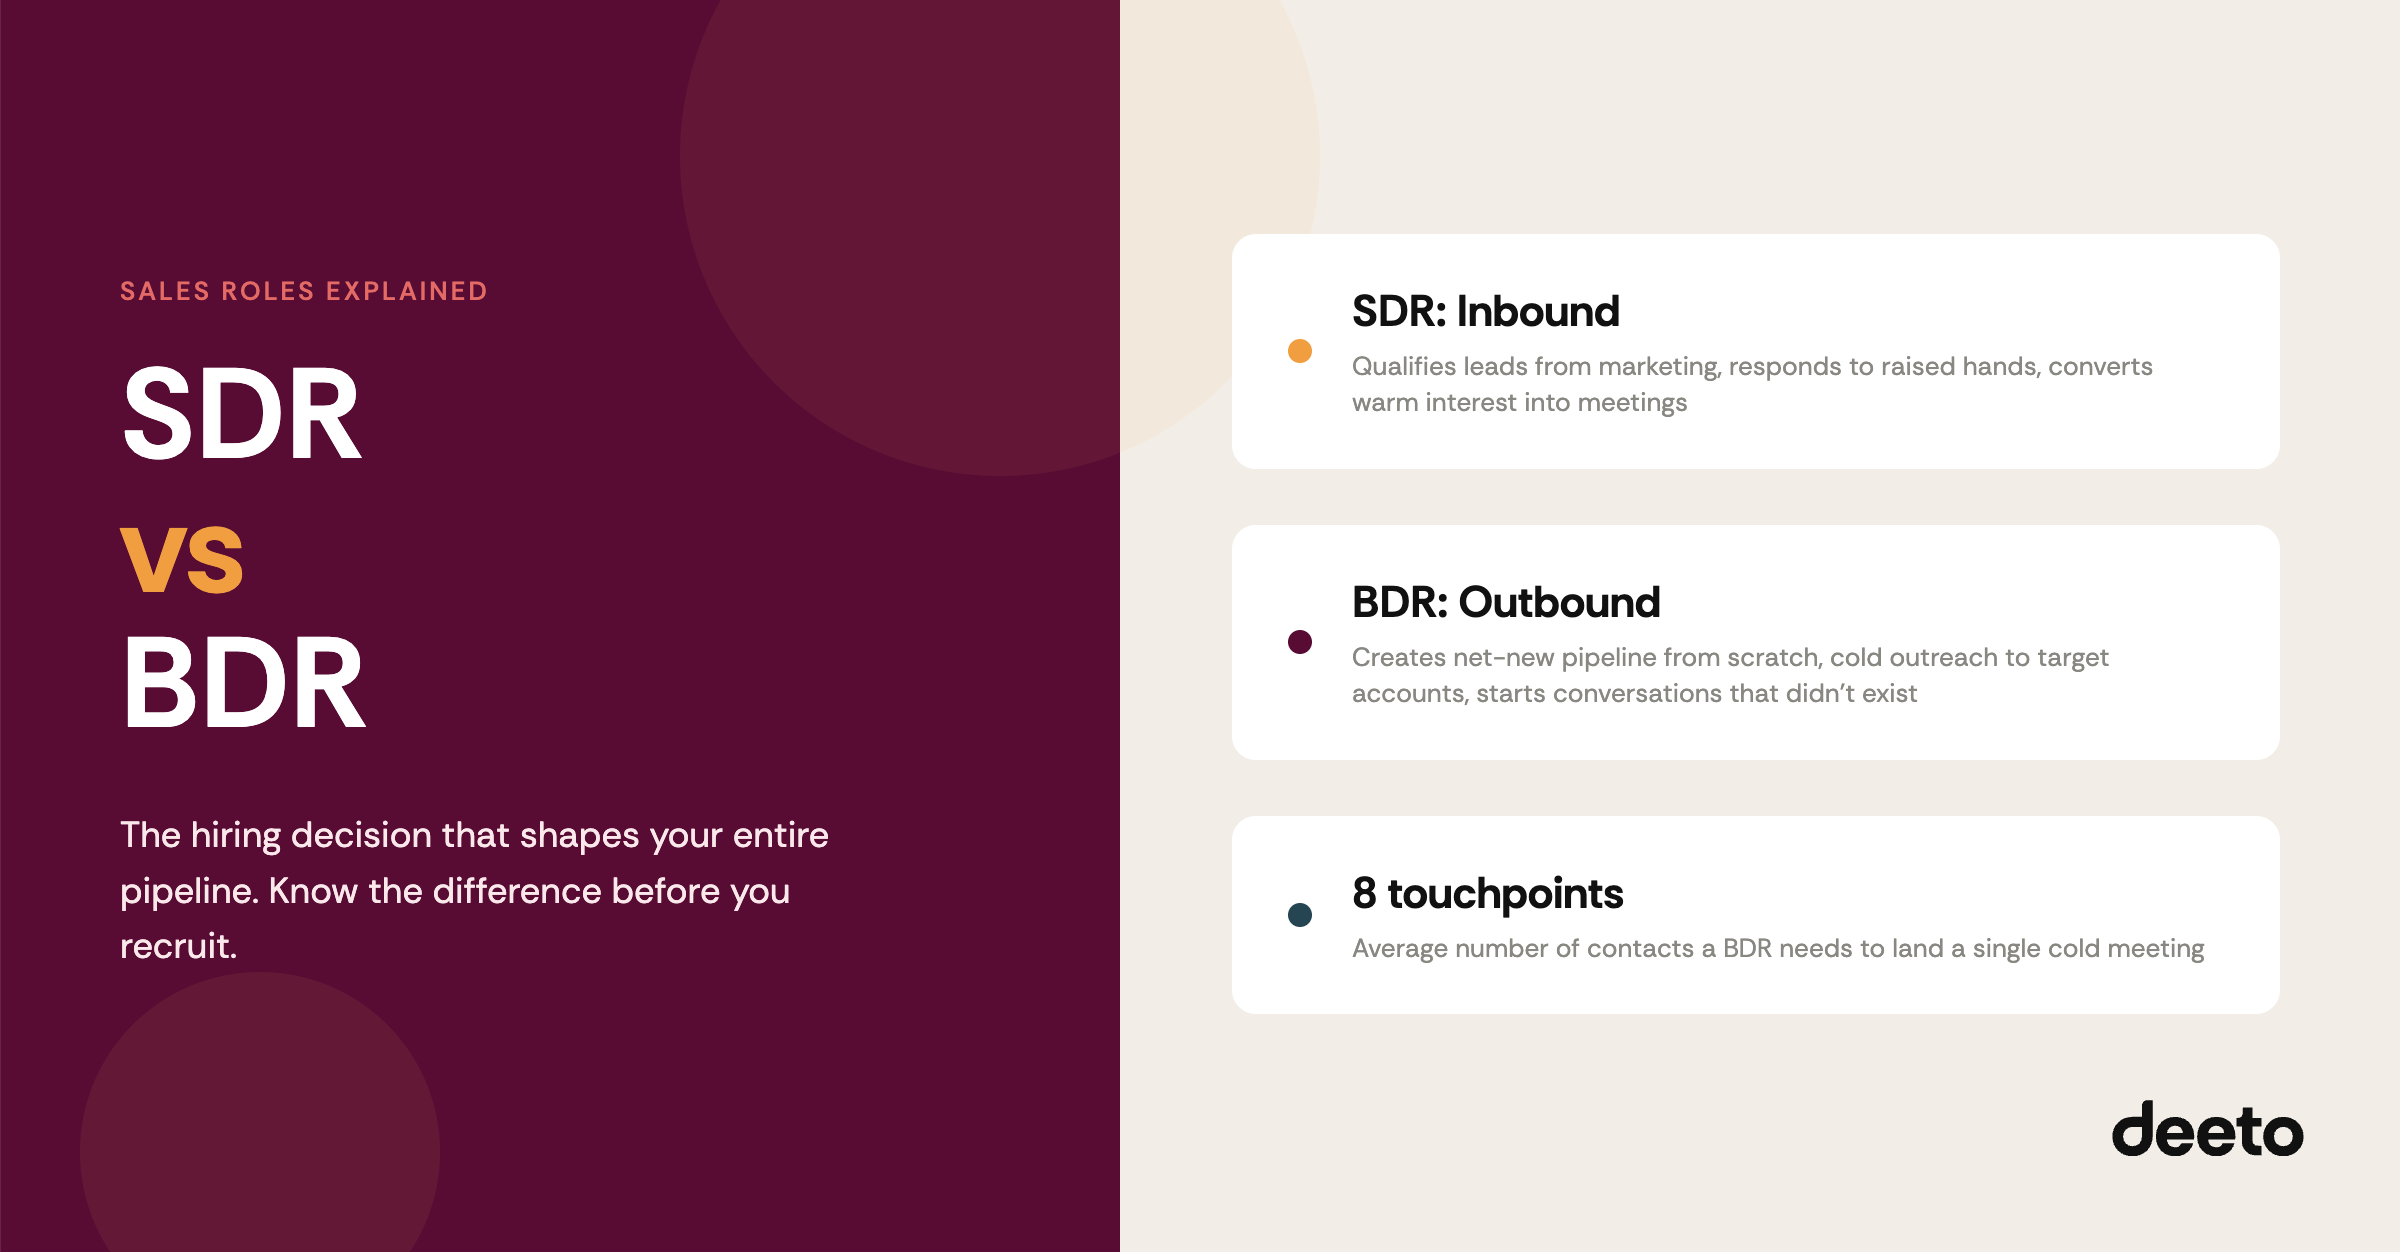
An SDR is the person who catches inbound interest before it goes cold. When someone downloads a guide, signs up for a webinar, or requests a demo, they've raised a hand. The SDR's job is to get there fast, figure out if the fit is real, and move the good ones to an Account Executive (AE).
SDRs work the leads that marketing already generated. They're not cold-calling strangers. They're following up on people who showed up and said "I'm interested,” and then deciding which of those people are actually worth an AE's time.
Day-to-day, an SDR is:
The SDR sits between marketing and sales. Marketing creates the signal. SDRs sort the signal from the noise.
A BDR starts from zero. No warm leads, no inbound signal, just a list of companies that fit your ICP and the task of turning strangers into interested prospects.
Where an SDR reacts, a BDR goes looking. They research accounts, find the right decision-makers, and reach out cold through calls, emails, and LinkedIn. Their goal isn't to close anything. It's to start a conversation that wasn't happening before.
Day-to-day, a BDR is:
It takes an average of 8 touchpoints to land an initial meeting from cold outreach. That's not a typo. BDRs need to be comfortable sending message six to someone who hasn't replied to messages one through five.
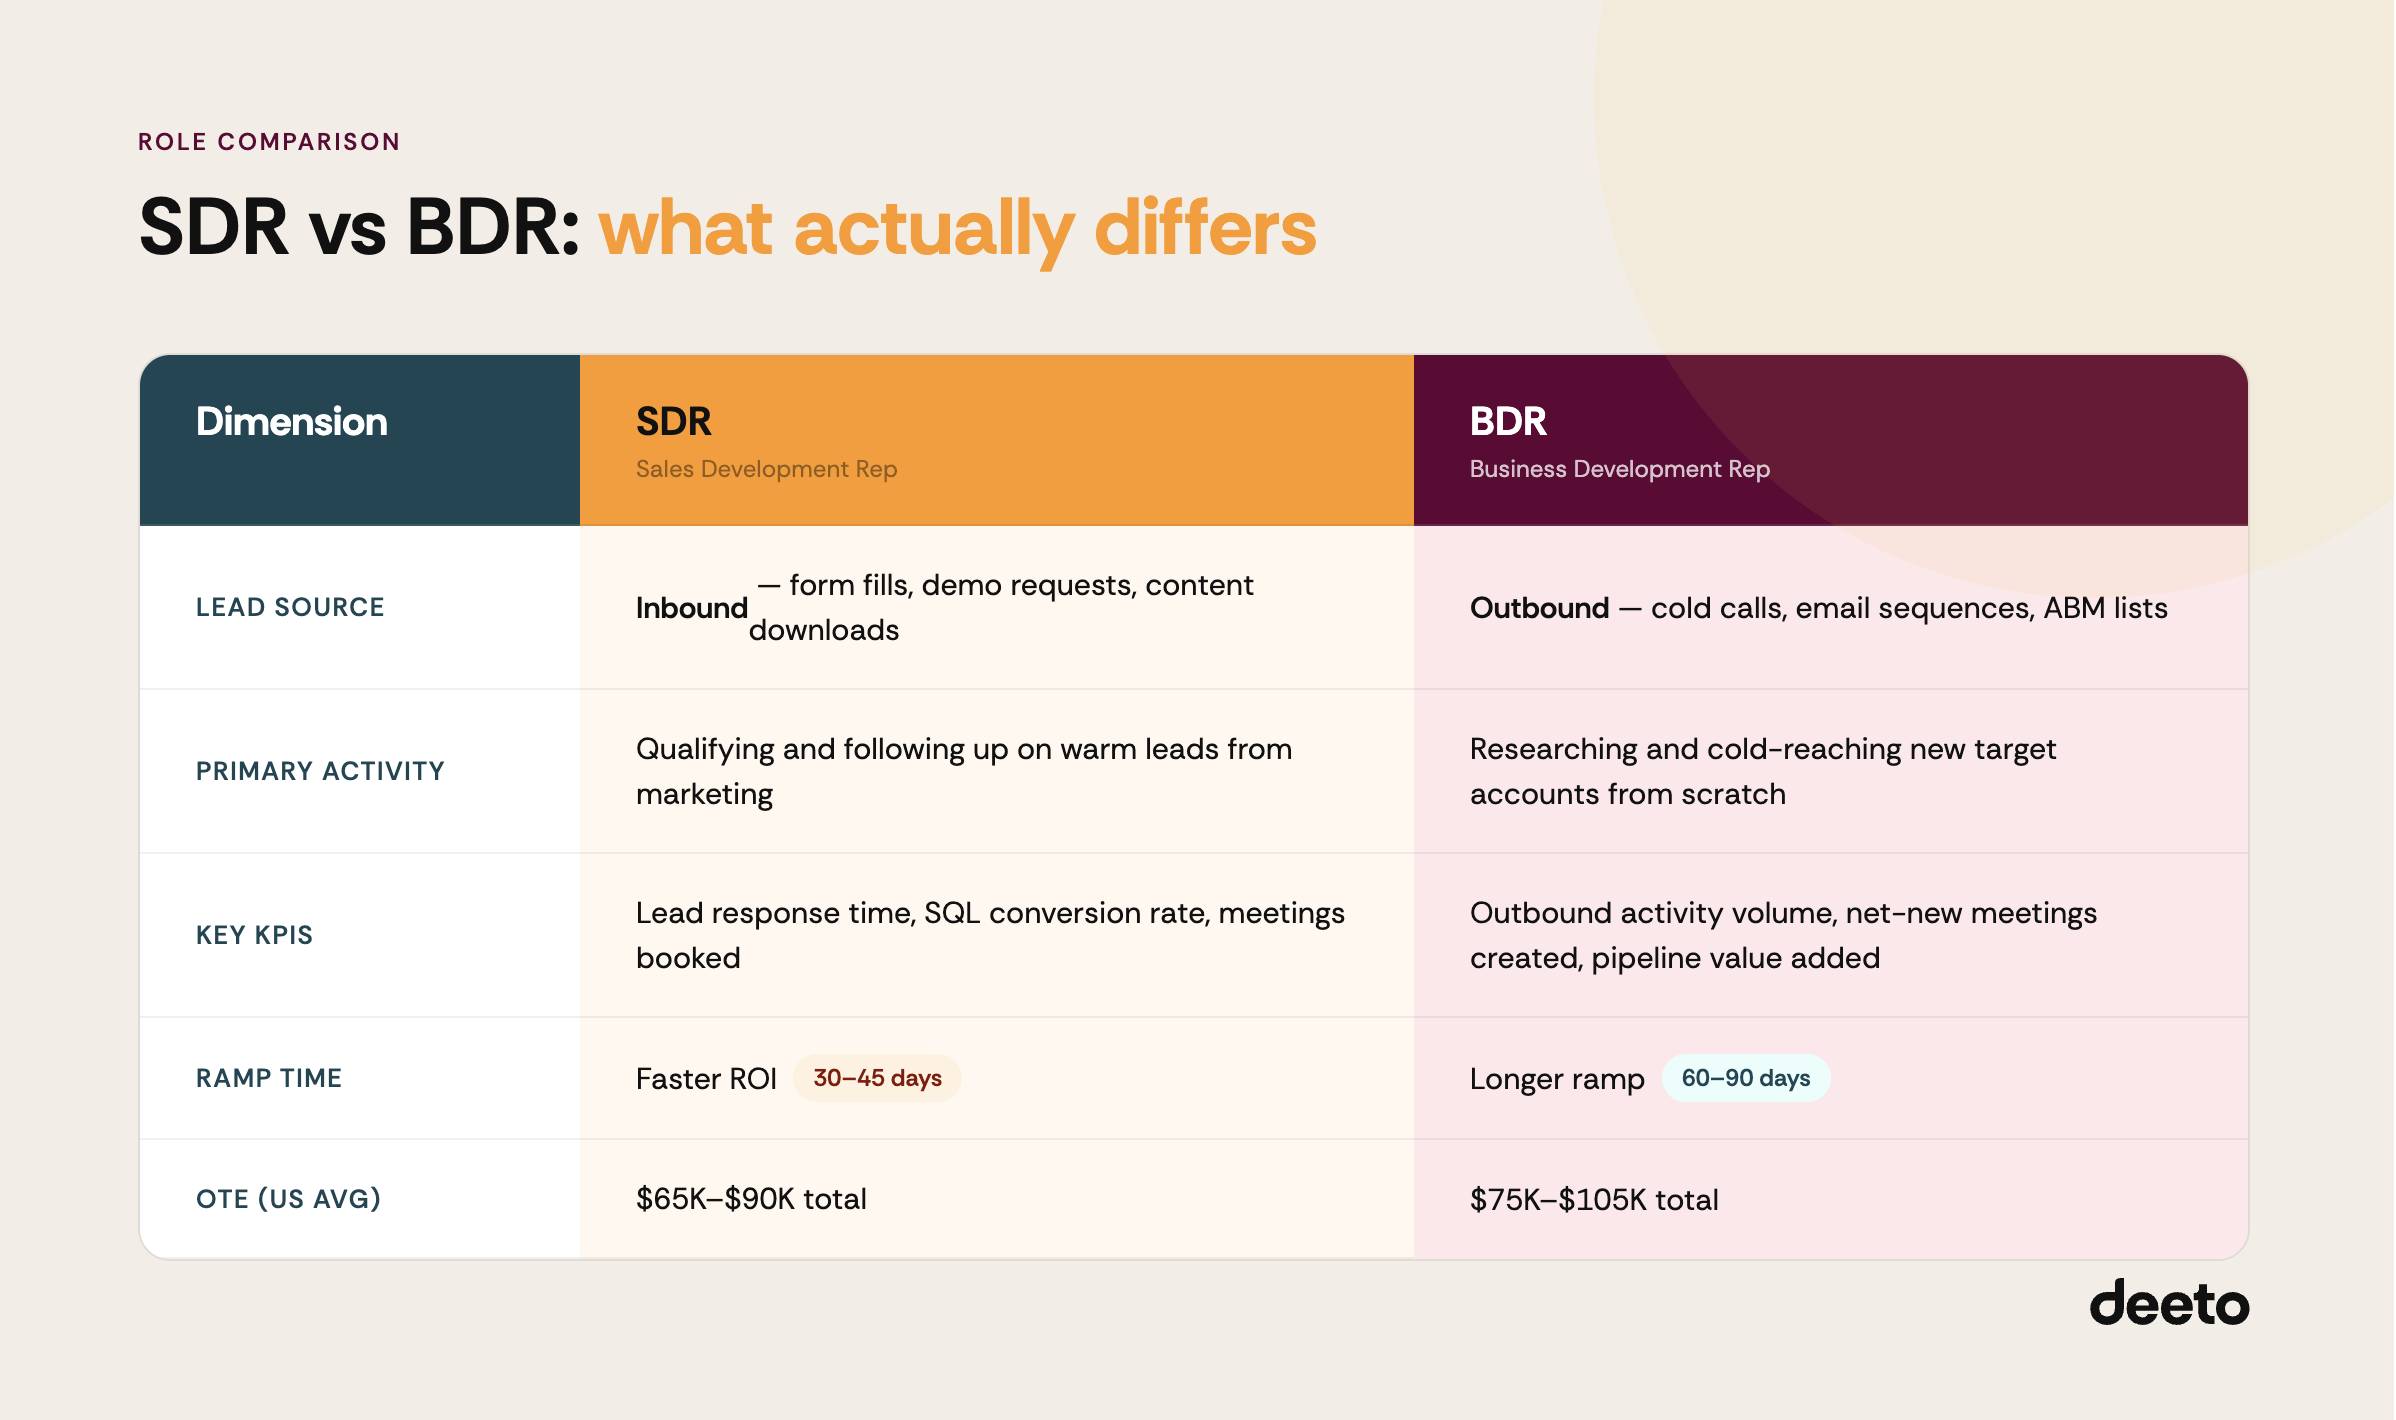
Here's how the two roles differ across the dimensions that actually matter for hiring and team structure.
Lead source
SDR: Inbound — form fills, demo requests, content downloads, webinar signups
BDR: Outbound — cold calls, cold emails, LinkedIn prospecting, ABM target lists
Primary activity
SDR: Qualifying and following up on warm leads from marketing
BDR: Researching and cold-reaching new target accounts from scratch
Prospect awareness
SDR: The prospect already knows your product exists
BDR: The prospect may have never heard of you
Qualification depth
SDR: Goes deeper to confirm readiness, budget, and fit on leads that already showed interest
BDR: Starts broader to confirm whether a need exists at all before going further
Key KPIs
SDR: Lead response time, SQL conversion rate, meetings booked
BDR: Outbound activity volume, meetings created with net-new accounts, pipeline dollar value added
Reporting line
SDR: Often reports to Marketing or a VP of Sales Development
BDR: Typically reports to Sales or Revenue leadership
Where they sit in the funnel
SDR: Middle — bridging marketing-generated demand and AE-led sales conversations
BDR: Top — creating demand where none existed
Compensation (US average)
SDR: $50,000–$65,000 base, $15,000–$25,000 variable
BDR: $55,000–$70,000 base, $20,000–$35,000 variable
BDR OTEs tend to run higher because cold outreach takes longer to ramp and involves a lot more rejection. The comp difference reflects that reality.
BDRs start with a blank page. They identify companies that fit the ICP including the right size, right vertical, and right buying signals. Then they map the decision-makers inside those accounts. Since the prospect hasn't shown any interest yet, BDRs are doing basic first-pass qualification: is there a problem here worth having a conversation about?
SDRs start with context. They're working with people who have already engaged in things such as downloading something, attending a webinar, or clicking an ad. That doesn't mean the lead is good, but it does mean the SDR can skip the "are you even aware we exist" part and get straight to fit and readiness.
Cold outreach is harder than it sounds. A BDR who sends a generic email gets ignored. A BDR who references a specific business challenge, a recent company announcement, or a relevant customer story from the same vertical actually gets replies. Building that kind of personalization at volume is the core BDR skill, and it takes time to develop.
SDRs are working warm. Speed matters more than personalization here. Responding within minutes of a conversion event, not hours, is the difference between catching a lead while they're still thinking about you and losing them to whoever showed up first. From there, SDRs use follow-up sequences to keep engagement alive until the prospect is ready for a call with an AE.
BDR teams are measured on pipeline creation. How many outbound activities went out this week? How many meetings did that turn into? How much pipeline dollar value got added? Some teams also track conversation rate (the percentage of cold outreach attempts that turn into actual back-and-forth exchange), which is a useful proxy for messaging quality.
SDR teams are measured on conversion efficiency. Lead response time matters a lot, and so does SQL-to-opportunity conversion rate. If a high percentage of qualified leads are moving to the Opportunity stage, SDRs are doing their filtering job well. If that rate is dropping, it usually means either lead quality from marketing is slipping, or SDRs are passing through leads that shouldn't be moving forward.
Both SDR and BDR are early-career roles. The typical progression goes: SDR or BDR (0–2 years), then Senior SDR/BDR, then Account Executive, then Senior AE or Sales Manager.
Some companies position BDR as the more senior of the two — cold outreach requires more self-direction and resilience than working inbound, and that's worth recognizing in title and comp. Other companies use the titles interchangeably or run it the other way. What actually matters is whether the person's day-to-day is inbound or outbound, not what the business card says. That distinction shapes reporting structure, KPIs, and what the person needs to get good at next.
Both roles are inside sales, both do the pre-work before AEs take over, neither is closing deals, and both eventually hand off leads to the same Account Executives. This means a bad handoff from either direction creates the same problem for the AE.
There are two places the roles complement each other:
Sharing intelligence. BDRs talk to cold prospects all day. They hear what objections come up before someone's even agreed to a meeting, which verticals are responding well, which messages are landing. SDRs hear the other side including what inbound leads are actually worried about, or what made them click. When these two teams share notes, both get sharper. It's one of the more underrated collaboration opportunities in a sales org.
Routing leads cleanly. Sometimes a BDR finds a prospect who turns out to have already engaged with marketing, that's called an SDR hand-off. Sometimes an SDR surfaces an account that needs a more deliberate, strategic outbound approach rather than standard follow-up cadencing. Clean routing, with a shared definition of what "qualified" actually means at your company, keeps both pipelines from leaking.
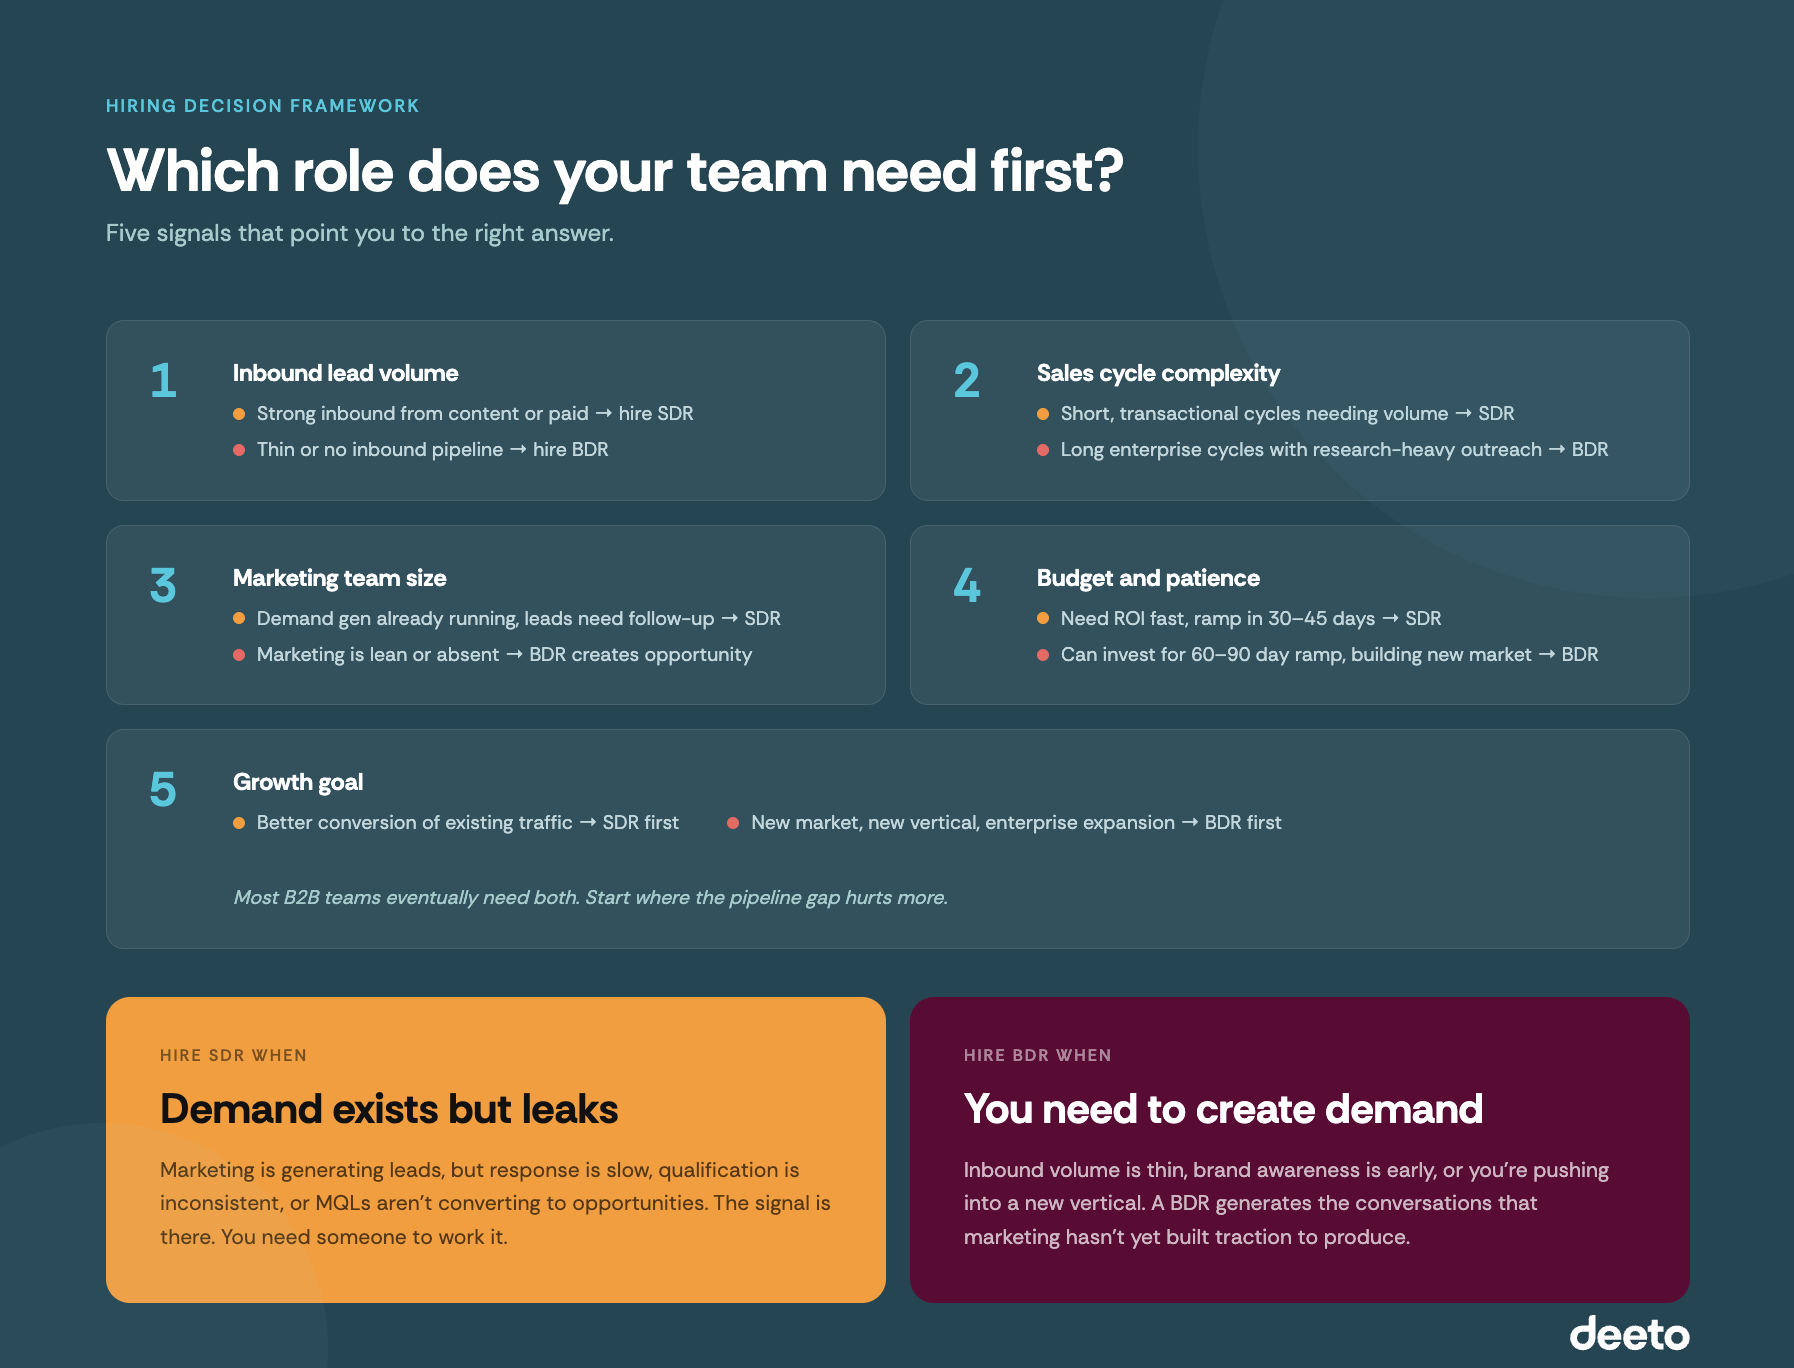
Should I hire an SDR or a BDR?
This is the question most people actually want answered. The honest answer: it depends on where your pipeline problem is.
If marketing is already generating leads and they're not getting followed up fast enough or filtered well, hire an SDR. The demand is there. You need someone to work it.
If inbound volume is thin, brand awareness is early, or you're pushing into a new vertical or market, hire a BDR. They'll generate the conversations that marketing can't yet produce.
The following five factors can help sharpen the decision:
Most scaling B2B companies eventually need both. The question is which gap is costing you more right now.
How technology fits in
The tools SDRs and BDRs use are similar but the workflows are different.
CRM is the foundation. Every call, contact update, and handoff to an AE happens inside it. Clean CRM integration matters because pipeline reporting is only as accurate as the data going in.
Sales engagement platforms like Outreach and Salesloft help both roles manage outreach sequences, automate follow-ups, and track what's getting opened and replied to.
Lead enrichment tools like Apollo, ZoomInfo, and Clearbit give BDRs the account data they need to build target lists, and help SDRs flesh out inbound leads before the first call.
Where both roles consistently struggle is knowing what content to send during early conversations. Generic case studies sent cold get ignored. A customer story from the same industry, referencing a challenge the prospect recognizes, is different. Deeto's sales enablement solution surfaces the right customer proof for the right account automatically, inside the rep's existing workflow. No more digging through a shared drive or asking marketing for something that doesn't exist yet!
This matters more than it might seem. Gartner research shows 75% of B2B buyers prefer a rep-free experience. Forrester puts the number at 85% of buyers trusting customers in their industry over any other source. The best early-conversation asset an SDR or BDR can send isn't a pitch deck. It's someone who's been in the prospect's exact situation, talking about what changed.
81% of sales organizations are either testing or already using AI tools, according to Salesforce's 2024 State of Sales report. That number has been climbing fast, and it's showing up inside the SDR and BDR workflow in concrete ways: lead prioritization, automated first-touch responses, email personalization at scale, call analysis, and AI-built prospect research for outbound sequences.
What AI doesn't change is the underlying skill. Reading a prospect, earning trust in the first two minutes of a call, knowing when to disqualify and move on — those are still human jobs. What changes is how much time reps spend on the parts that don't require them to be human.
The reps getting good results with AI tools aren't treating them as a shortcut to volume. They're using them to prepare better and respond faster, so the conversations themselves are sharper.
What is the difference between an SDR and a BDR?
An SDR qualifies inbound leads — people who have already engaged with your marketing in some way. A BDR generates outbound pipeline by reaching out to prospects who haven't engaged yet. SDRs respond to existing interest. BDRs create new interest from scratch. Both hand off qualified opportunities to Account Executives rather than closing deals themselves.
Which is more senior — SDR or BDR?
It depends on the company. Some treat BDR as more senior because cold outreach requires more self-direction and resilience than qualifying warm leads. Others use the titles interchangeably or position SDR as the more advanced role. What matters more than the title is whether the rep is working inbound or outbound. That distinction shapes the skills, KPIs, and career path.
Can one person do both SDR and BDR?
Yes, and many early-stage companies run it this way. A single rep handling both inbound qualification and outbound prospecting is practical when headcount is limited. The tradeoff is focus; the two jobs require different daily rhythms, and combining them tends to dilute both over time. As the team grows, separating the roles typically improves output in both directions.
What are typical SDR and BDR salaries?
In the US, SDR base salaries typically run $50,000–$65,000 with $15,000–$25,000 in variable. BDR base salaries tend to be slightly higher at $55,000–$70,000 with $20,000–$35,000 variable since outbound is harder to ramp and involves more rejection. Both ranges vary by company stage, geography, and industry.
Do SDRs or BDRs report to sales or marketing?
SDRs frequently report to marketing or a shared sales development function, because their work is tied to marketing-generated lead flow. BDRs typically report to sales or revenue leadership, because their output is outbound pipeline. In practice, both roles sit at the boundary between marketing and sales, which is exactly why getting the reporting line right matters.
When should I hire an SDR vs a BDR first?
Hire an SDR first if you have solid inbound volume and leads aren't getting followed up quickly or filtered well. Hire a BDR first if inbound volume is low, brand awareness is early, or you're trying to break into a market where marketing hasn't yet built traction. If both are problems, prioritize the gap that's costing you more pipeline today.
SDR vs BDR isn't really a debate about titles. It's a question about where your pipeline comes from and who owns getting it there.
SDRs convert existing interest. BDRs create new interest. Both matter. The sequencing question (which one to hire first), comes down to where the gap in your pipeline actually is.
Once reps are in the field, the quality of what they send to prospects matters as much as how many times they reach out. Deeto helps SDRs and BDRs show up with the right customer proof for the right account, without digging for it manually. See how it works.

Explore SDR vs. BDR roles: learn their distinct tasks, goals, & when to use each. Master sales strategies!
Most business decisions get made without ever asking the customer.
That sounds like an exaggeration until you start counting. The renewal on Friday's calendar. Did anyone interview the customers up for renewal first? The feature your team shipped Monday. Did anyone talk to the first users before sales started pitching it? The three target accounts that went to a competitor last quarter. Did anyone ever ask them why?
Most teams want to. The decisions stack up faster than the customer voice that should inform them, and the existing tooling almost fits, but not quite. Advocacy programs work great for advocacy. Generic AI interviews work great for general discovery. Win/loss tools work great for the deals that closed. The renewal at risk, the launch interview, the win/loss research on prospects you didn't close? Those keep getting put off, because no version of the existing tooling fits the decision in front of them.
We just shipped Custom Briefs. It closes that gap.
Authentic voice drives every decision. That's what Deeto's built around. Until today, that worked for some decisions. After today, you can build an AI Interview for any of them. Book a demo to see it in action.
Pre-built question sets, generic AI interviews, and win/loss interviews aren't going anywhere. They're great at the jobs they're built for, and Deeto customers will keep using all three. Custom Briefs is the addition: AI Interviews tailored to the specific decision you're trying to make, with whatever audience that decision involves.
The split is clean. You stay in control of the brief. The Brief Agent does the contextual work that surveys can't.
Path 1 is what most teams reach for first. Open the AI Assistant. Type something like "help me build a brief for renewal interviews on at-risk accounts." The Brief Agent runs a focused three- to five-question conversation back, pulling in your existing briefs and Company Researcher data so you're not starting from scratch. You answer a handful of questions about goal, audience, and tone. You get a brief.
Path 2 is for when you already know exactly what to ask. Specify the must-include questions yourself, and the Brief Agent works strictly inside that script. The live interview adapts follow-ups in real time to what each respondent says, but it never asks anything you didn't put on the list.
Most teams that try Custom Briefs start with Path 1 and graduate to Path 2 once they have a brief that works and want to lock it in for repeat runs.
A few of the decisions Custom Briefs was built to support:
The flow change is the headline. A few specific limits go away too.
Audience picker covers customers, prospects, or both. Until today, only Loss Campaigns could target prospects.
The audience and the email are visible on one screen. The old multi-step audience config is gone.
Briefs are shared across your team's library. If a teammate already built the brief you need, start from theirs and tweak.
Custom Briefs is the fourth release on Deeto's agentic platform, after AI Interviews, the AI Assistant, and Potential References. Each one made the next one easier to ship.
Here's what a working agent looks like, in Deeto's view. It runs a focused conversation. Three to five questions, not twenty. It checks context. Your existing briefs, your Company Researcher data, so it doesn't duplicate or ignore what's already in your account. And it outputs something usable: a brief, an audience, an email, all reviewable on one screen.
The Brief Agent does all three. It's built on LangChain Agent Builder. It lives inside the AI Assistant with a distinct visual identity, so you always know which agent is responding.
The architecture matters too. Deeto's product is organized around five modules: Listen, Learn, Activate, Analyze, Orchestrate. Custom Briefs lives in Listen. That's where you capture the voice in the first place. But every brief you run feeds the rest. The Briefs library is part of Learn. The campaigns are Activate. The analytics are Analyze. The agentic flow underneath is Orchestrate. Custom Briefs is the moment the system starts.
Customer voice that only lives inside Deeto isn't enough. It needs to flow into every tool your team uses to make decisions.
That's what MCP is for. The voice you generate through Custom Briefs is queryable through Deeto's MCP server. Run a brief on renewing customers this week. Tomorrow, your AE prepping the renewal call queries those insights from Claude or their custom agent through MCP. Same data, different surface.
Briefs make the signal. MCP carries it where decisions get made.
A top-level orchestrator agent that routes you to the right specialist agent without you needing to know which module to open. That's the next step.
Custom Briefs is live in your account today. Open the AI Assistant and ask it to help you build a brief.
See it live: Book a demo

Custom Briefs is here. AI Interviews on Deeto, now built for the decision in front of you. Just ask the AI Assistant.
Most companies don't have a churn problem. They have a data quality problem that makes churn invisible until it's expensive.
By the time a cancellation lands in your CRM, the decision was made weeks ago. The customer stopped logging in. Support tickets went unresolved. The last check-in got no reply. Every signal was there. Nobody saw them in time.
The real problem is not churn itself, but the gap between when customers start disengaging and when your team finds out.
Harvard Business Review puts the cost of acquiring a new customer at five to 25 times more than retaining one. Bain and Company found that a 5% increase in retention can lift profits by as much as 95%. Those numbers get cited everywhere. What gets cited less often is why companies keep losing customers anyway: they don't have a system that surfaces risk early enough to act on it.
The 12 strategies below are the playbook for closing that gap.

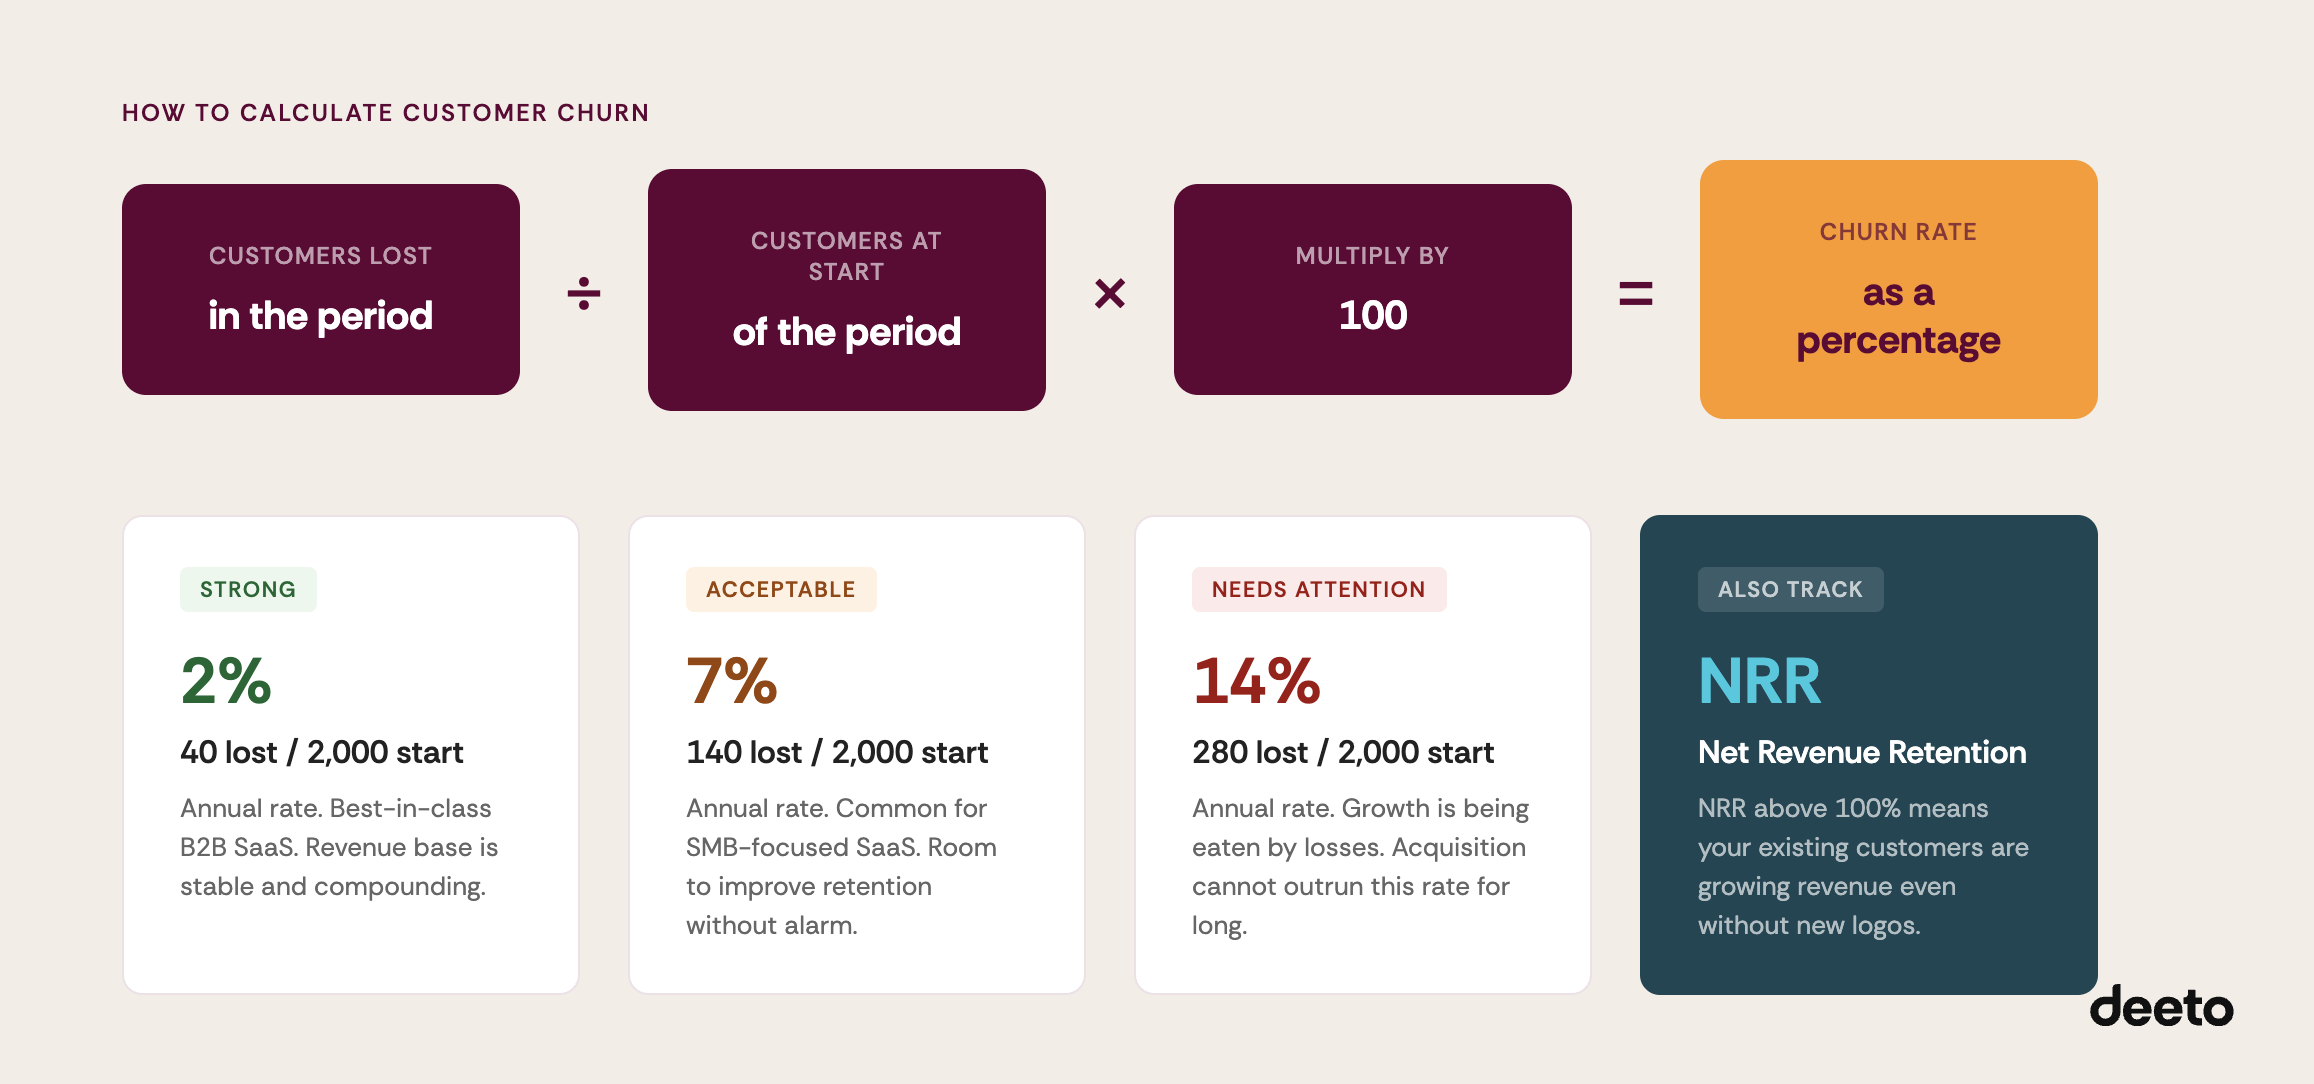
Customer churn is the percentage of customers who stop doing business with you over a defined period.
Churn rate = (Customers lost during the period / Customers at the start of the period) x 100
If you started the quarter with 500 customers and ended with 475, your churn rate is 5%.
It compounds quietly. A 5% monthly churn rate means you're losing more than half your customer base in a year. And unlike acquisition costs, the damage is often invisible until it shows up in revenue.
For more on this, see our primer: What Is Customer Churn?
Most companies assume customers leave over price. The actual reasons are usually more mundane: slow support, no early wins, weak onboarding, or neglect after the sale.
Common patterns include customers who never reach a meaningful outcome in their first 30 days, unexpected friction in the product, support issues that dragged on long enough to erode trust, and poor communication during renewals or product changes.
None of the strategies below work unless you know which of these actually applies to your customers.
You can't fix what you haven't diagnosed. Churn analysis isn't a one-time report; it's a habit of asking what actually happened before a customer left.
Start by standardizing how you record churn reasons. "Not a fit" tells you nothing. "Customer never adopted the core workflow after onboarding" tells you where the failure was, and whether it happened to others. When churn reasons are structured and specific, you can track trends, find the leakiest parts of your customer lifecycle, and prioritize fixes.
Combine quantitative signals (usage drops, NPS dips, support ticket frequency) with qualitative ones (exit interviews, cancellation call notes). The combination is where real insight usually lives.
Most churn is decided in the first 30 to 90 days. Customers who don't reach a meaningful outcome early will disengage and cancel without much warning.
Strong onboarding does three things: it defines what success looks like, it gets customers to their first win fast, and it maps what value looks like beyond initial setup.
Check your onboarding flow for these common failure points: no clear definition of what "success" looks like at 30 or 60 days, too many steps before the customer experiences the core value, and no follow-up after initial setup.
Customer adoption is not a launch moment. It’s a structured process of guiding customers toward the outcomes they bought for.

By the time a customer reaches out with a problem, trust has often already eroded. Waiting for them to raise their hand isn't a retention strategy.
Proactive engagement means checking in at key lifecycle moments, sharing relevant tips based on what the customer is actually using, and communicating changes that affect their workflow before those changes land.
A short check-in call framed around "are you getting the result you expected?" often surfaces both risk signals and buying intent. It's one of the highest-return touchpoints in the customer lifecycle.
Customers rarely leave because they dislike your product. They leave because they're not confident it's delivering enough value for the effort required.
Education closes that gap. Build practical content around the moments where customers typically get stuck: onboarding decisions, feature configuration, reporting to internal stakeholders. Track which content customers actually use. If a significant portion skips the same onboarding module, that's a retention leak.
Educated customers become advocates. Confused ones churn.
Churn is almost always visible before it happens. The challenge is having a system that surfaces those signals in time to act.
Watch for behavior shifts that indicate disengagement: declining login frequency, support tickets that are escalating or going unresolved, missed check-ins or unanswered outreach, invoice delays or payment failures, drops in NPS or survey response rates.
McKinsey found that companies using analytics-driven retention programs can reduce churn by up to 15%. But risk signals don't reduce churn by themselves. They only work if they trigger a clear, assigned action.
Churn prediction works when it's connected to ownership and workflow, not just a dashboard.
Not all churn carries the same weight. Losing a high-value enterprise customer who's been with you three years is different from losing a free trial user who never finished onboarding.
Segment by what actually matters: revenue contribution, expansion potential, strategic importance, advocacy value. Then direct your retention resources toward the segments where losing customers hurts most.
Gartner research consistently shows that roughly 20% of customers generate 80% of future revenue. Treating every customer with the same retention energy misallocates resources.
A high-value account at risk might need an executive sponsor call. A recently onboarded customer with low usage might need a session with your CS team. Match the intervention to the situation.
One of the most underestimated drivers of churn is a lack of visible ROI. Customers may know your product is useful without being able to articulate why they should renew, especially when budget discussions come around.
Make value visible before renewal conversations happen. Send periodic summaries that show what the customer has achieved using your product. Tie outcomes to the goals they stated when they bought.
This is where value realization becomes a retention strategy. When customers can clearly articulate the ROI, renewals are straightforward. When they can't, every renewal becomes a negotiation.
Feedback isn't only input for your product team. It's one of the earliest indicators of churn risk.
Customers who feel heard stay longer. Customers who surface issues and get no response leave faster and usually quietly.
Build feedback loops that are easy to use and actually close the loop with a response. NPS and CSAT scores are a start, but the most useful feedback often comes from structured conversations, not numbers.
Deeto's customer sentiment analysis tools help CS and customer marketing teams track how sentiment shifts across accounts over time, so risk signals surface before they become cancellations.
Customers don't expect perfection. They expect to feel like their problems matter.
A slow response is frustrating. A slow response with no update is a trust-breaker. Audit your support experience: average time to first response versus what you promise, escalation paths when tier-one doesn't resolve the issue, and proactive communication when resolution takes longer than expected.
Customers who have a problem handled well often become more loyal than customers who never had a problem. The recovery is a relationship-building moment, if you treat it that way.
Incentives can reinforce retention. They can also train customers to wait for discounts before renewing.
Use them to reward behavior, not to plug gaps in value. Programs that offer early access, priority support, or exclusive content signal "we value this relationship." Discounts offered reactively to at-risk accounts signal "our price is negotiable."
If you have a customer reference program, long-term customers are your most credible advocates. Case studies, advisory boards, and speaker opportunities deepen the relationship in ways that discounts don't.
Deeto helps customer success and customer marketing teams build structured advocacy and reference programs that keep high-value customers engaged well beyond the renewal cycle.
Generic experiences feel disposable.
Personalization starts with context: knowing where a customer is in their lifecycle, what goals they stated when they bought, what challenges they've raised through support, and what features they're actually using.
Use that context to shape your outreach, your success plans, and your renewal conversations. A customer actively using a feature you just improved should hear about that improvement. A customer who hasn't logged in for 30 days should get a different message than one who logs in daily.
The customer experience layer of your retention strategy is where all the upstream work (feedback collection, sentiment analysis, product intelligence) becomes visible to the customer as attentiveness and care.
Not all churn is a decision. A significant portion of subscription revenue is lost through failed payments, expired cards, and billing errors.
Involuntary churn is fixable: automated dunning sequences, payment retries, proactive card expiry reminders, frictionless update flows.
For subscription businesses, involuntary churn can represent 20 to 40% of total churn. Recovering even a portion of it requires no additional retention effort, just better payment infrastructure.
Track it separately from voluntary churn. They have different causes and different fixes.


Every strategy in this list comes back to the same problem: churn is invisible until it isn't, and by then it's already expensive.
The companies that consistently retain customers aren't doing something magical. They've made risk visible. They know which accounts are disengaging before those accounts know it themselves. They've assigned ownership to the signals, built outreach into their operating rhythm, and connected customer feedback to the teams that can actually act on it.
That's what Deeto is built for. Not another dashboard — a system that closes the gap between what your customers are experiencing and what your team knows about it, so the right action happens at the right time.
If your churn is invisible, that's the place to start.
Book a demo and we'll show you what it looks like when the signals are finally in front of you.
What is the best way to reduce customer churn?
The most effective approach combines early risk detection, consistent value demonstration, and proactive engagement. Companies that build a structured retention system where risk signals are visible, ownership is assigned, and outreach happens before customers disengage, consistently outperform those that rely on reactive intervention. Retention is a system, not a single tactic.
What is a good customer churn rate?
Benchmarks vary by industry and business model. For B2B SaaS, monthly churn below 2% is generally considered healthy, which equates to roughly 22% annual churn. Enterprise-focused businesses often target annual churn below 5 to 7%. The most useful benchmark is your own trend over time, combined with an understanding of which segments are churning and why.
How do you identify customers who are about to churn?
The most reliable early warning signals: declining product usage, unresolved support tickets, delayed payments, missed check-ins, and drops in NPS or survey response rates. These typically appear weeks before a cancellation. The challenge is having a system that surfaces them consistently and routes them to the right person.
What is the difference between voluntary and involuntary churn?
Voluntary churn happens when a customer actively decides to cancel. Involuntary churn happens when a subscription lapses due to a failed payment, expired card, or billing error. Both affect revenue, but they require different fixes. Involuntary churn is often undertracked and can account for 20 to 40% of total churn in subscription businesses.
How does customer feedback reduce churn?
Customers who feel heard are more likely to stay. Feedback loops that close with a genuine response build trust and surface risk signals early. Customers who raise an issue and get no follow-up are significantly more likely to churn quietly. Connecting feedback to a system that routes it to the right team and tracks resolution turns customer voice into a retention tool.
What role does onboarding play in reducing churn?
Onboarding is where most churn risk is created or avoided. Customers who don't reach a meaningful outcome within the first 30 to 90 days are significantly more likely to disengage and cancel. Strong onboarding defines success clearly, gets customers to their first win fast, and maps a continued path to value.

Learn how to reduce customer churn with 12 proven strategies covering early risk detection, value proof, and more.
Losing customers is expensive. But most companies only realize how expensive after the damage is already done.
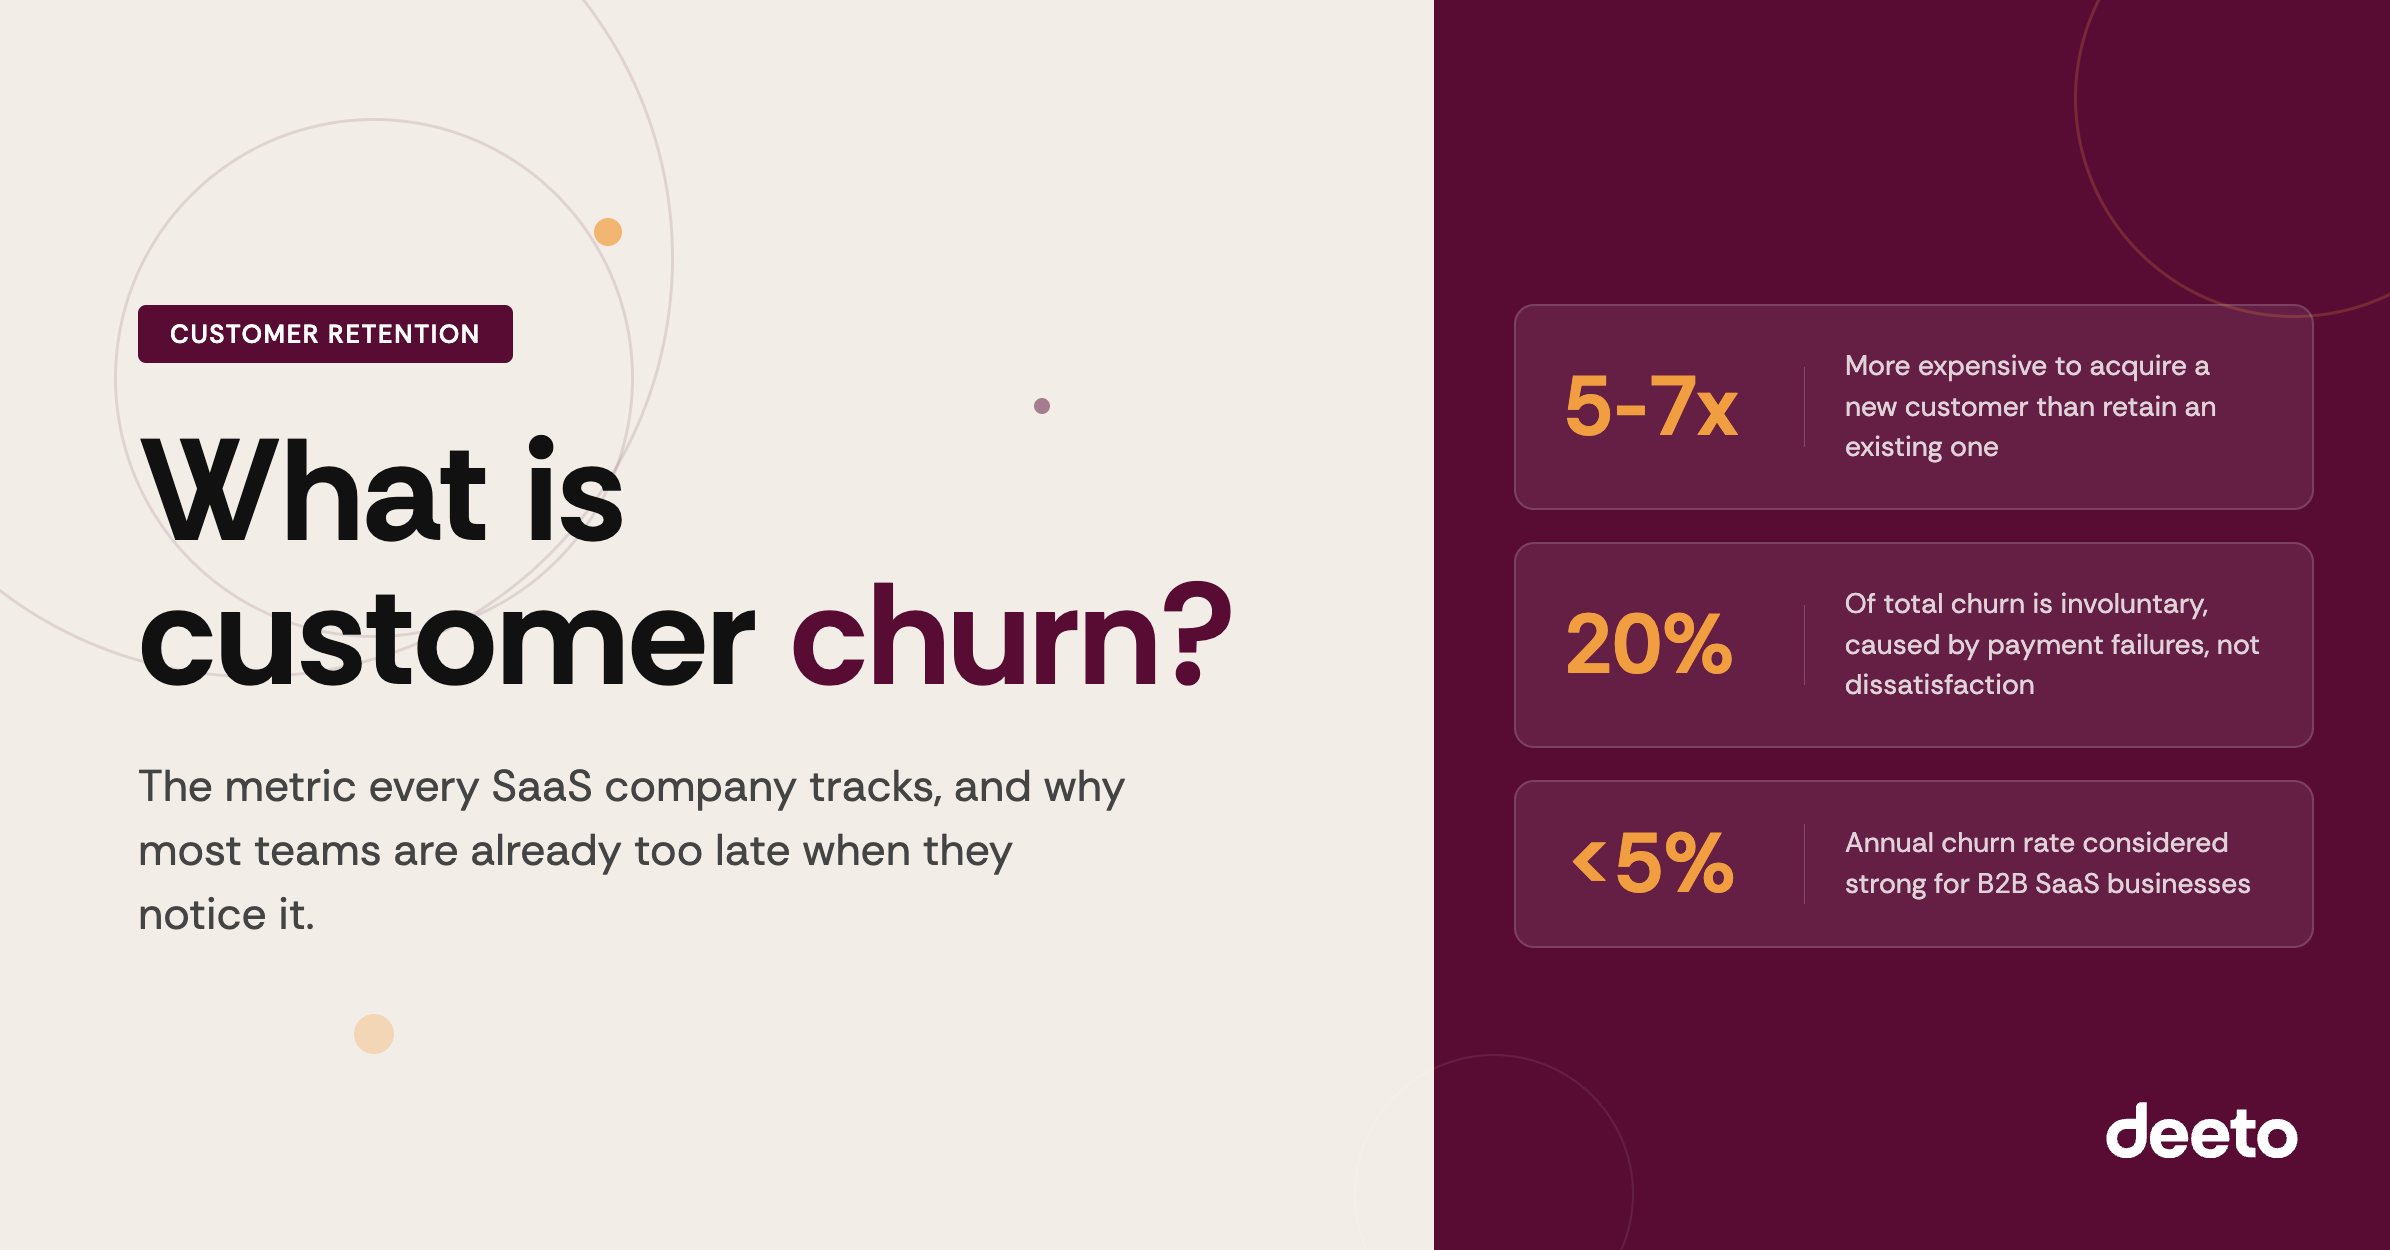
Customer churn is the percentage of customers who stop doing business with a company over a given period. It is one of the most closely watched metrics in SaaS and subscription businesses because even a modest increase in churn can quietly erase months of growth.
This guide covers what customer churn is, why it happens, how to calculate it, and what it actually takes to reduce it.
Customer churn, also called customer attrition, is the rate at which customers cancel, stop renewing, or otherwise stop purchasing from a company within a specific time period. It is typically expressed as a percentage and measured monthly, quarterly, or annually.
Churn is the direct opposite of customer retention. High retention means customers are staying. High churn means they are leaving, and your revenue base is shrinking under the surface even while new customers continue to come in.
For SaaS companies, the stakes are especially high. Subscription revenue depends on customers continuing to pay month after month. Customer churn is not a lagging signal of a problem that already happened. It is usually a leading signal of a problem that was never addressed.
Customer churn affects nearly every part of a SaaS business, from forecasting to fundraising.
Here is why it matters more than most companies acknowledge.
It erodes recurring revenue. In a subscription model, every customer who churns takes their recurring revenue with them. A 5% monthly churn rate means you are replacing roughly half your customer base every year just to stay flat.
It inflates acquisition costs. According to research from Bain & Company, acquiring a new customer can cost five to seven times more than retaining an existing one. When churn is high, the cost of backfilling lost revenue from new customers compounds quickly.
It signals product or experience problems. Customers rarely churn randomly. They churn because something was not working: onboarding was confusing, the product stopped delivering value, support was slow, or a competitor offered something better. Churn is a symptom. The disease is usually further upstream.
It affects company valuation. Investors in SaaS businesses treat net revenue retention (NRR) as one of the most important metrics. High churn suppresses NRR and can significantly reduce valuation multiples.
Customer churn is not just a customer success problem. It is a whole-company signal.
Customer churn falls into two categories:
Voluntary churn happens when a customer actively decides to leave. This includes cancellations, non-renewals, and account closures driven by dissatisfaction, price sensitivity, a shift to a competitor, or simply no longer needing the product.
Involuntary churn happens when a customer loses access for reasons outside their intent. Failed credit card payments, expired cards, and billing system errors are the most common culprits. Involuntary churn is often underreported, but it typically accounts for 20 to 40% of all churn in subscription businesses.
Understanding the split between voluntary and involuntary churn matters because the interventions are completely different. You cannot solve a payment failure with an onboarding improvement, and you cannot solve a dissatisfied customer with a dunning email sequence.
The standard customer churn rate formula is:
Customer Churn Rate = (Customers Lost in Period / Customers at Start of Period) x 100
For example: A company starts the month with 2,000 customers and ends with 1,880. They lost 120 customers.
120 / 2,000 x 100 = 6% monthly churn rate
That might not sound alarming. But a 6% monthly churn rate means roughly 54% of the customer base turns over every year.
Customer churn counts customers. Revenue churn measures dollars. For companies with customers of different sizes, revenue churn is often more important.
Revenue Churn Rate = (MRR Lost to Churn in Period / MRR at Start of Period) x 100
A company churning 10 small accounts and one enterprise account in the same month may show a low customer churn rate but a significant revenue churn rate. Tracking both gives a more complete picture.
Gross revenue retention (GRR) captures revenue lost to churn and contraction, without counting expansion. Net revenue retention (NRR) includes expansion revenue from existing customers through upsells and cross-sells.
An NRR above 100% means the existing customer base is growing even without new customer acquisition. Many best-in-class SaaS businesses target NRR of 110 to 130%.
Most churn does not come from one single event. It builds over time. These are the most common drivers:
Poor onboarding. Customers who do not reach their first meaningful outcome quickly are far more likely to churn in the first 90 days. If they cannot see the value of the product early, they will not believe in it later.
Low product engagement. Customers who are not actively using the product are quietly pre-churned. They are still paying, but they are not invested. Any friction, price increase, or competitive alternative can tip them out.
Unresolved friction. Support tickets that go unanswered, bugs that recur, integrations that break. Small frustrations compound over time into a decision to leave.
Price-to-value misalignment. Customers leave when they feel they are paying more than they are getting. This is often a perception problem as much as a pricing problem. If customers cannot articulate what the product is doing for them, the price will always feel too high.
Competitive displacement. A better option at a lower price point, or a competitor that does one specific thing significantly better, can trigger churn even among otherwise satisfied customers.
Changing business needs. In B2B, organizational changes like layoffs, pivots, or budget cuts often drive churn that has nothing to do with product quality.
The common thread across most churn reasons is a failure of listening. Companies that know what their customers are experiencing, what they need, and where frustration is building are the ones that can act before a customer decides to leave. Deeto's churn prediction use case is built specifically around surfacing these early warning signals from customer voice data.

Benchmarks vary widely, but here are ranges commonly cited across the industry:
Annual B2B SaaS churn rate:
Monthly B2B SaaS churn rate:
SMB-focused SaaS products typically see higher churn than enterprise-focused ones because smaller companies go out of business, change tools more freely, and have less contract lock-in. Enterprise churn rates tend to be lower but the revenue impact per churned account is significantly higher.
There is no universal "good" churn rate. The right benchmark depends on your market segment, contract lengths, and pricing model.
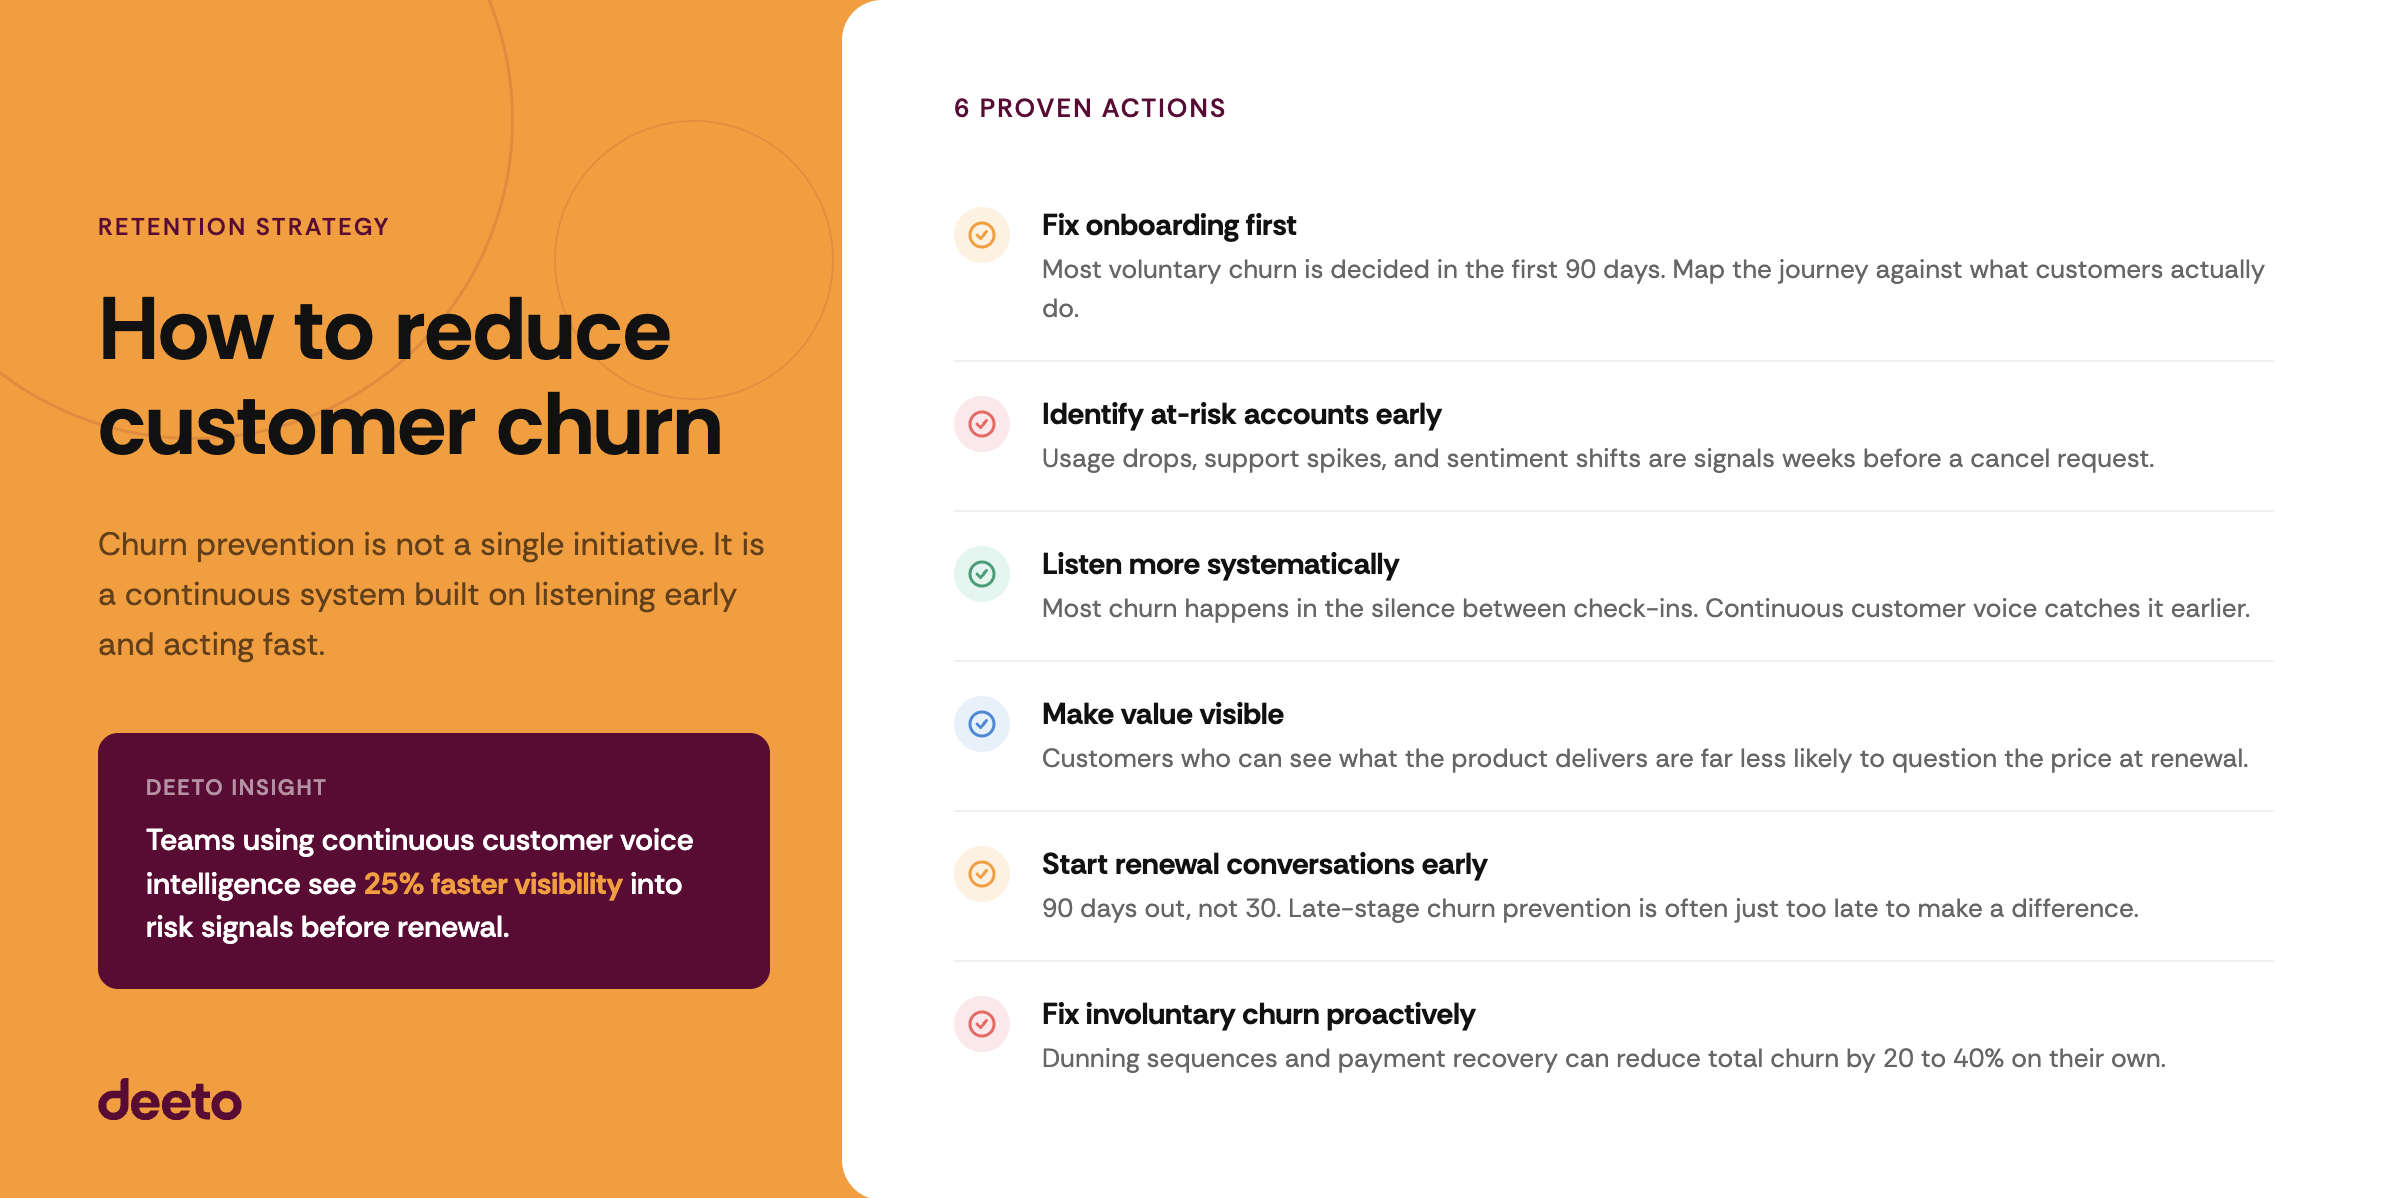
Reducing customer churn is not a single initiative. It is a continuous system.
Fix onboarding first. The first 30 to 90 days are when most voluntary churn is decided, even if it does not show up in the data for months. Customers who reach their first meaningful outcome quickly are significantly less likely to leave. Map the onboarding journey against actual customer behavior, not what you hope customers do.
Identify at-risk accounts early. Do not wait for the cancellation email. Use product usage data, support ticket patterns, NPS scores, and customer sentiment signals to flag accounts before they make the decision. Customers who stop using a product but have not yet cancelled are already at risk. Deeto's customer sentiment analysis capability helps customer success teams see these signals continuously, not just at renewal time.
Listen more systematically. Most churn happens in the silence between check-ins. Companies that have ongoing conversations with customers, through interviews, in-product feedback, and structured touchpoints, understand problems before they compound. The customer success team at companies using Deeto report 25% faster visibility into risk signals compared to reactive approaches.
Make value visible. Customers who can see what the product is delivering are far less likely to leave. Quarterly business reviews, product ROI summaries, and regular communication about what is working all reinforce the relationship and make the renewal conversation easier.
Improve renewal processes. Start renewal conversations 90 days out, not 30. Give customer success teams visibility into account health, product engagement, and open issues before the renewal date arrives. Late-stage churn prevention is often too late.
Address involuntary churn proactively. Set up automated dunning sequences, card update reminders, and failed payment recovery workflows. Some estimates suggest that fixing involuntary churn alone can reduce total churn by 20 to 40%.
Close the loop on feedback. When customers give feedback, tell them what you did with it. Customers who see their input reflected in the product or in how they are served are more likely to stay and more likely to advocate. Deeto's customer voice intelligence platform connects feedback directly to the teams who can act on it.
There is a pattern inside most high-churn SaaS businesses: nobody is actually listening to customers until they leave.
Exit interviews capture what went wrong after the decision is made. Annual NPS surveys produce a score with no clear line of sight to action. Feedback goes into a spreadsheet that nobody owns.
The companies that consistently keep churn low do something different. They treat customer voice as continuous intelligence, not a periodic event. They know which accounts are frustrated before those accounts cancel. They know what features are not landing before product builds more of them. They know which customer success conversations are high risk before the renewal date arrives.
Deeto is built around this model. Customer voice goes in through Listen. Intelligence is organized through Learn and Analyze. Insights are delivered to the teams who need them through Activate. The output is not just better reporting. It is faster action on the signals that predict churn before it happens.
The problem is not that companies lack customer data. Most have too much of it, scattered across CRMs, support platforms, survey tools, and email inboxes. The problem is connecting that data to decisions.
Customer churn is one of those metrics that is easy to rationalize in the short term and very hard to unwind once it compounds. A 1% improvement in monthly churn has a larger impact on long-term revenue than most acquisition campaigns.
The companies that win on retention are not doing something exotic. They are listening to their customers more consistently, acting on what they hear faster, and making customer voice part of how every team makes decisions.
That is the model Deeto is built on. If you want to see how it works in practice, book a demo.
What is customer churn in simple terms?
Customer churn is the percentage of customers who stop paying for or using a product within a given time period. If a company starts the month with 1,000 customers and ends with 950, the churn rate is 5%. High churn means the business is losing customers faster than it would like, which directly reduces recurring revenue.
What is a good customer churn rate for SaaS?
For annual B2B SaaS, a churn rate below 5% is generally considered strong. Monthly churn below 0.5% is excellent. Benchmarks vary significantly by segment: SMB-focused products typically have higher churn than enterprise products because smaller businesses change tools more readily and have less contractual lock-in.
What is the difference between customer churn and revenue churn?
Customer churn measures the number of customers lost. Revenue churn measures the monthly recurring revenue (MRR) lost. For businesses with customers of different sizes, revenue churn is often more meaningful. A company can have low customer churn but high revenue churn if the accounts being lost are its largest ones.
What is the most common reason customers churn?
Poor onboarding is the single most common driver of early-stage churn. Customers who do not reach a meaningful outcome quickly lose confidence in the product before they fully use it. Longer-term churn is more often driven by low engagement, unresolved product friction, or a competitor offering a better alternative.
What is the difference between voluntary and involuntary churn?
Voluntary churn happens when a customer actively decides to cancel or not renew. Involuntary churn happens when access is lost due to failed payments or billing errors, not by choice. Involuntary churn can account for 20 to 40% of total churn and is often overlooked because it looks like it is being handled by billing systems when it actually requires a proactive recovery strategy.
How do you predict customer churn before it happens?
The most reliable early signals of churn include declining product usage, reduced login frequency, unresolved support issues, low NPS or CSAT scores, and negative sentiment in customer conversations. Companies that monitor these signals continuously, rather than waiting for renewal conversations, are able to intervene earlier and retain accounts that would otherwise quietly decide to leave.

Learn what customer churn is including causes, how to calculate churn rate, and strategies to reduce it in SAAS.
The best customer experience platforms in 2026 do more than collect feedback. They connect what customers say to what teams actually do. This guide compares the top customer experience (CX) platforms across nine categories, from enterprise voice-of-customer tools to AI-powered service platforms, so you can find the right fit for your organization's goals.
Choosing the wrong CX platform means paying for data you can't act on. Most teams already know that. The harder question is: what separates a platform that captures experience from one that actually improves it?
This guide covers the top platforms, what each one does best, and how to evaluate them based on your team's real needs.

A customer experience platform is software that helps organizations collect, analyze, and act on customer feedback across the full lifecycle. The best platforms go beyond surveys and support tickets to connect customer signals to decisions in sales, marketing, product, and customer success.
Customer experience platforms vary widely in scope. Some focus narrowly on support operations or NPS collection. Others span the entire customer lifecycle, surfacing voice, sentiment, and behavioral signals that guide strategy across the organization.
Customer experience software includes tools for voice-of-customer research, sentiment analysis, journey tracking, service management, and customer intelligence. What the category does not yet do well, in most cases, is connect all of those signals into a coherent system that drives action. That gap is where a new generation of platforms is emerging.
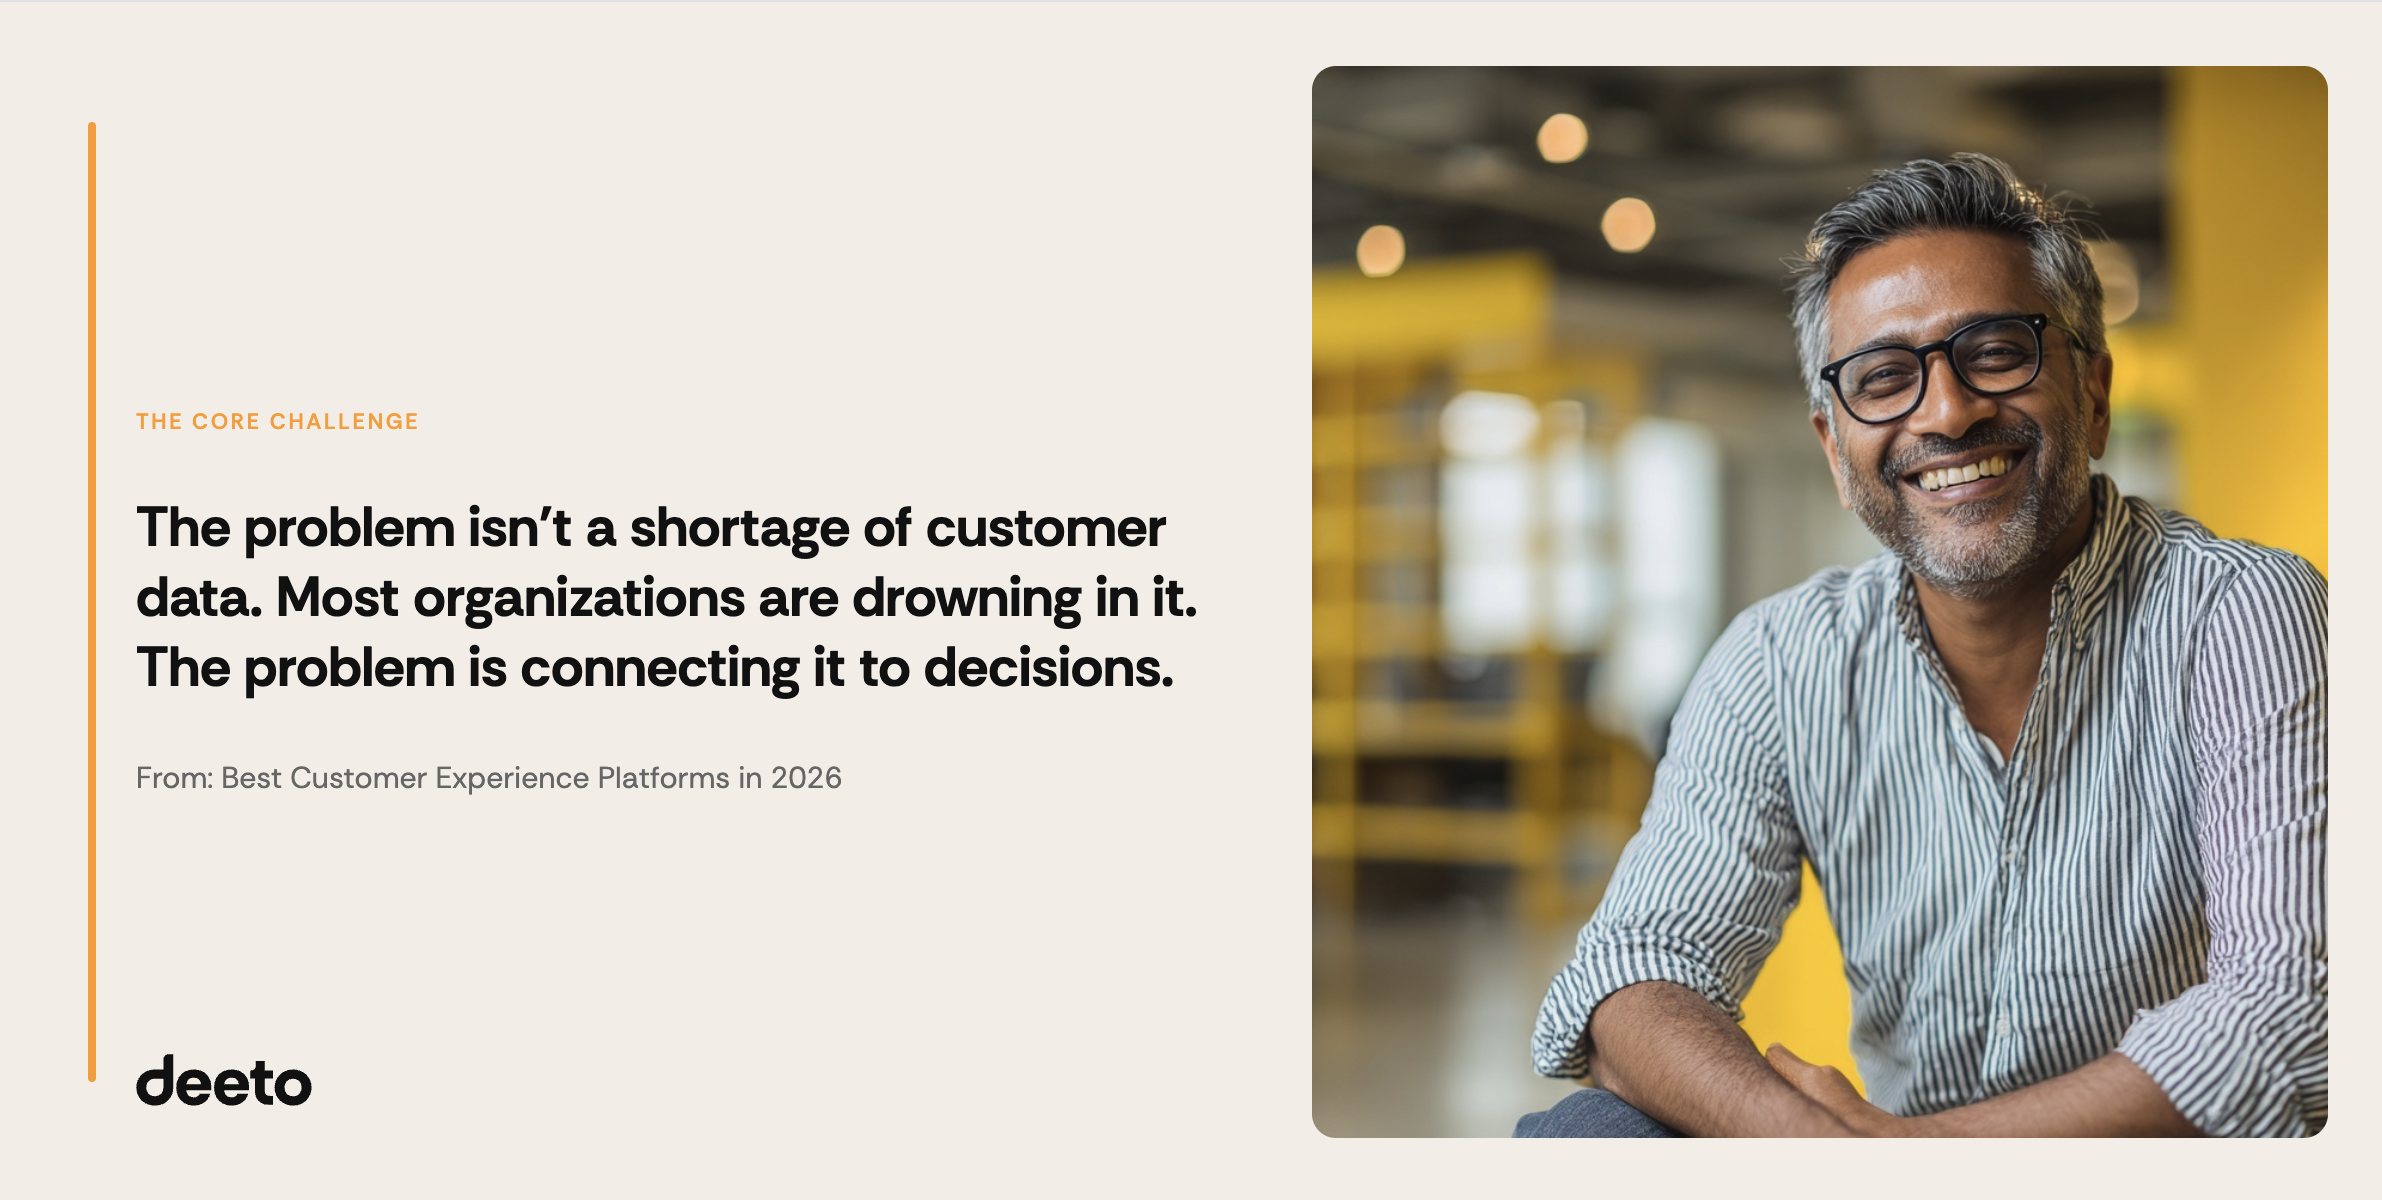
By 2026, 89% of businesses are expected to compete primarily on customer experience, surpassing product and price as the primary differentiators. The global customer experience management market was valued at approximately $17.2 billion in 2026 and is projected to reach $47.72 billion by 2033, growing at a CAGR of 15.2% (Grand View Research). That investment is not going into more surveys. It is going into platforms that can turn signal into action.
The pressure is real: customers expect personalized, responsive, and consistent experiences across every channel. Teams that rely on disconnected tools, quarterly NPS scores, or siloed feedback programs are already behind. The problem is not a shortage of customer data. Most organizations are drowning in it. The problem is connecting that data to the decisions that actually affect customer experience, and that is exactly what the best platforms in this guide are built to do.
Before comparing specific tools, align on what your team actually needs. The most common misbuys in this category come from evaluating features before use cases.
Key questions to ask before you buy:
No single platform is best for every team. The platforms below are each the best in their category, for the right buyer.
Best for: B2B teams that need to turn customer voice into connected intelligence and action across sales, marketing, product, and customer success.
Deeto is an AI-native customer orchestration platform built to connect authentic customer voice to the decisions that drive growth, retention, and product direction. Where most customer experience platforms stop at collection or reporting, Deeto closes the loop, surfacing the right insight to the right person at the right moment through integrations with CRM, enablement tools, and marketing workflows.
The platform organizes around five modules: Listen captures voice through AI interviews, surveys, and in-product signals; Learn stores and connects all customer intelligence in a searchable system of record; Analyze identifies patterns, sentiment, and trends; Activate delivers insights into the tools reps, marketers, and CSMs already use; and Orchestrate automates the workflows that keep intelligence flowing across the org.
Deeto's customer experience use case is purpose-built for teams that need more than a dashboard. It connects sentiment signals, churn prediction, and voice-of-the-customer data into a single platform that drives action, not just awareness.
For customer success teams, Deeto surfaces renewal intelligence and at-risk signals before they become problems. For customer marketing teams, it captures customer stories, advocacy signals, and proof that fuel campaigns and conversion. Teams using Deeto see 15 to 25% higher renewal and expansion rates and 20 to 30% faster sales cycles through contextual customer intelligence.
Deeto is the platform to consider when your CX goal is not just to understand what customers think, but to make their voice the system that powers every team's work.
What to watch: Deeto is built for B2B organizations that already have a customer base to engage. It is not a general-purpose customer service or ticketing tool.
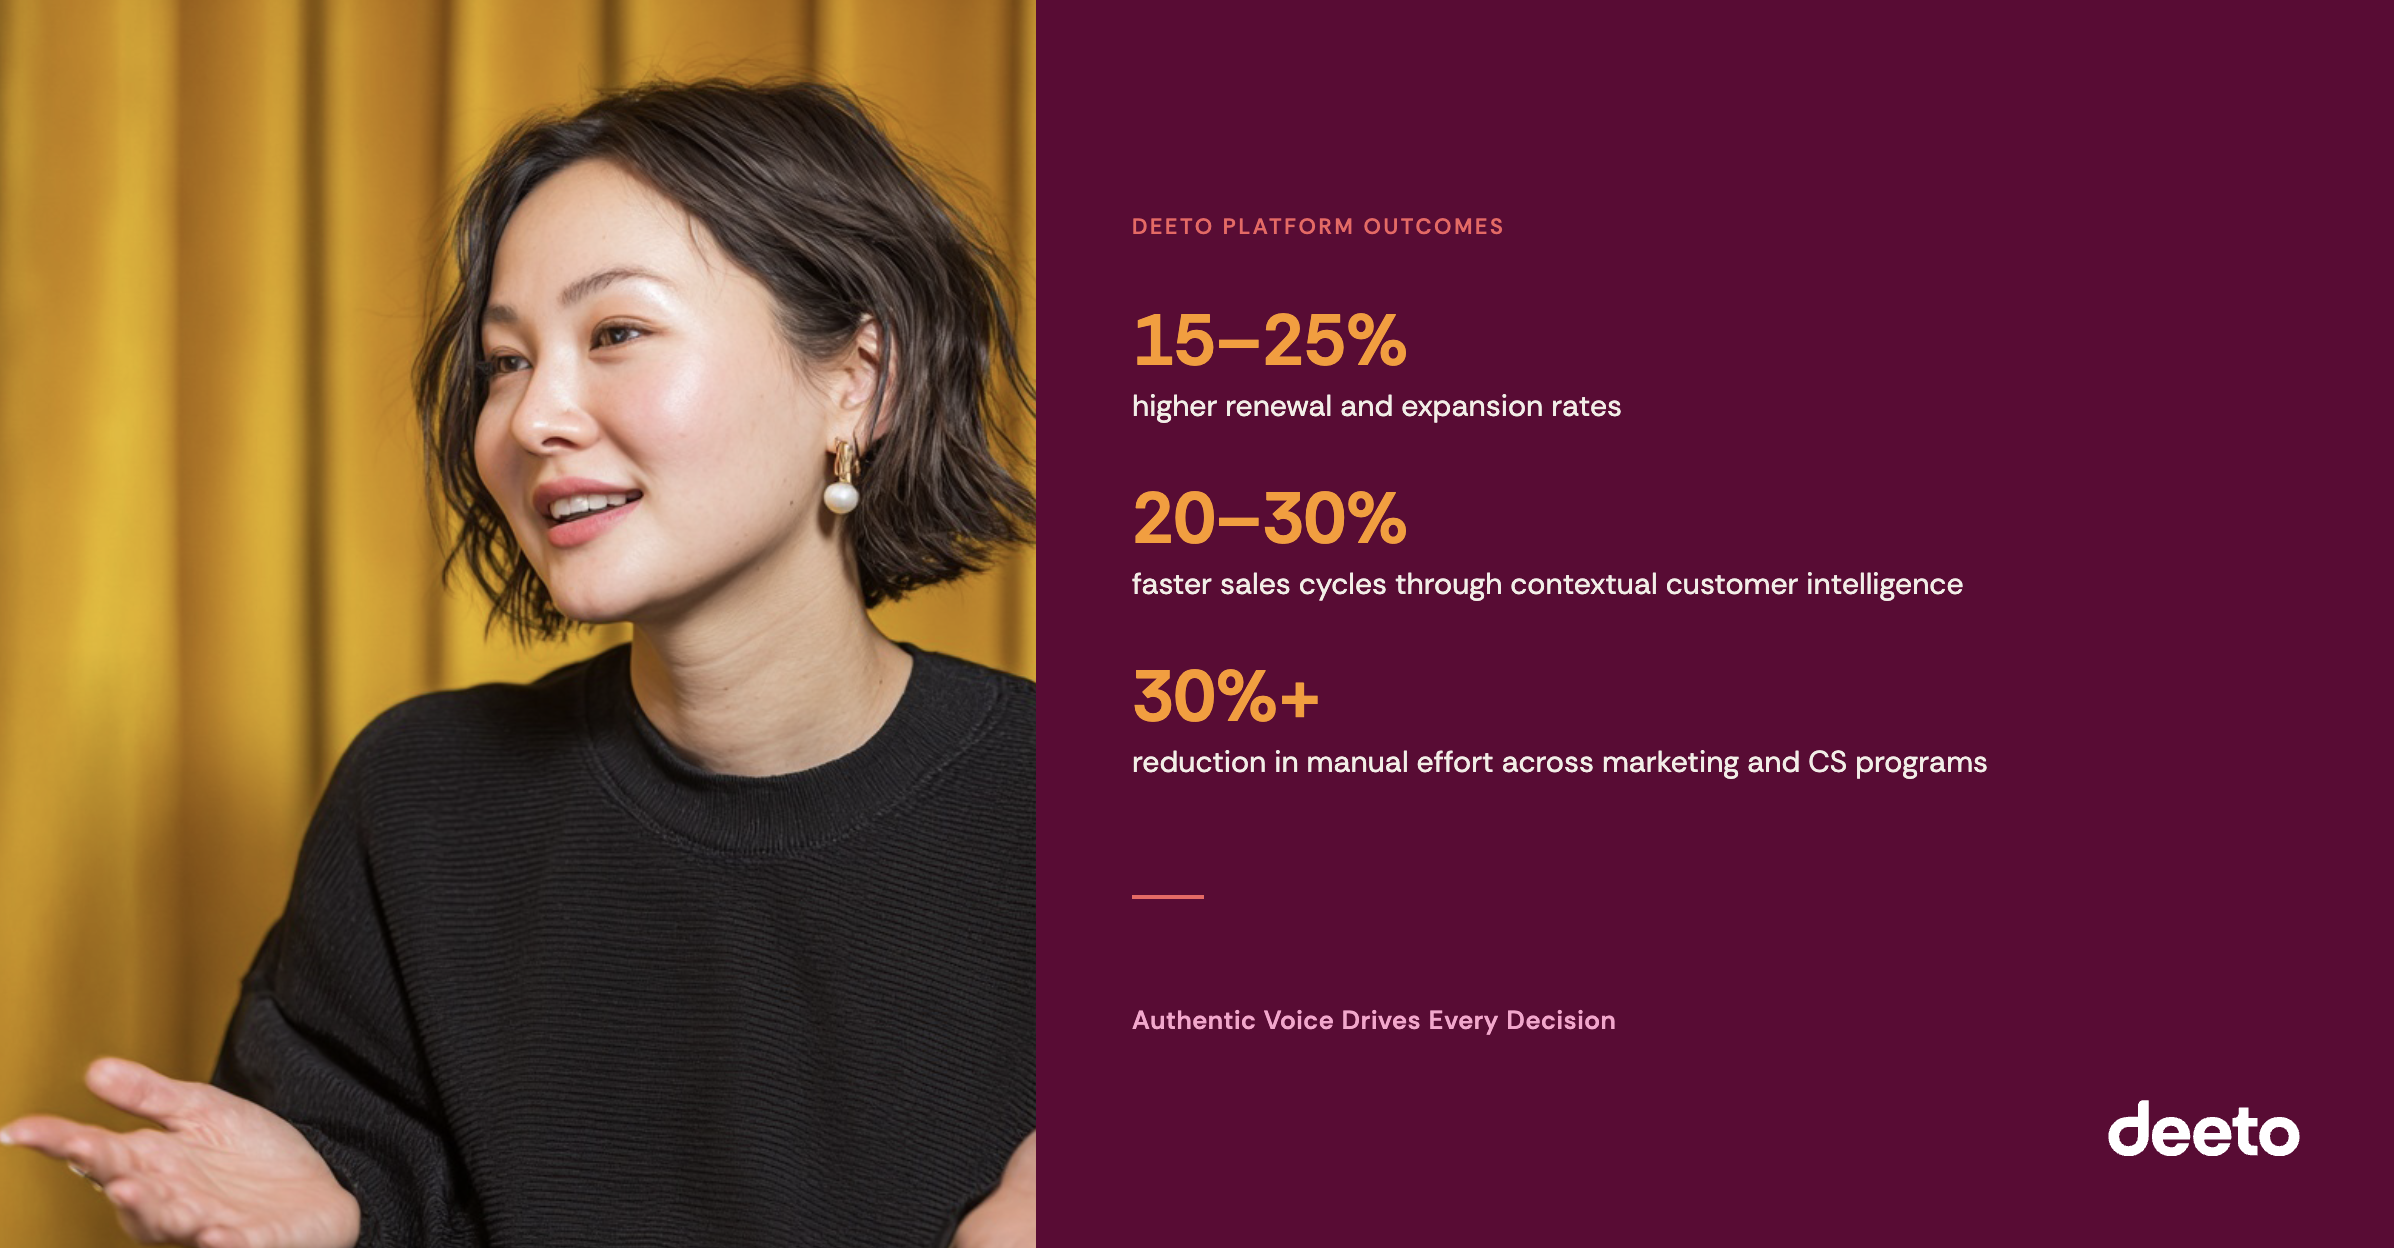
Best for: Enterprise organizations running company-wide experience management programs that span customer, employee, and product research.
Qualtrics XM is one of the most established names in the experience management category. It captures and analyzes customer experience data across touchpoints using sophisticated survey tools, predictive AI, and deep statistical analysis. The platform is well-suited to large organizations with dedicated research teams and the budget to match.
Qualtrics excels at structured research: quantitative surveys, conjoint analysis, brand tracking, and benchmarking programs. It integrates with most enterprise data stacks and produces the kind of executive-level reporting that large CX programs require.
The tradeoff is complexity. Qualtrics is a powerful platform that requires investment to configure, maintain, and act on. Teams without dedicated research or analytics resources often find the platform underutilized relative to its cost.
What to watch: Implementation timelines can be long. The platform rewards investment but requires it in return.
Best for: Enterprise teams capturing signals across high-volume, multi-channel customer interactions including voice, digital, IoT, and social.
Medallia is an enterprise-scale experience platform that ingests customer signals from a wide range of sources: surveys, support calls, social mentions, app behavior, and sensor data. Its AI and text analytics capabilities are among the strongest in the market, making it a fit for organizations managing CX at significant scale and complexity.
Medallia's strength is breadth of signal capture and the real-time analytics engine that sits on top of it. Large enterprises in financial services, healthcare, and retail use it to run continuous listening programs that feed into operational dashboards and frontline alerts.
Where Medallia is less strong is activation. Surfacing an insight in a dashboard is not the same as routing it to the sales rep, product manager, or CSM who can act on it. For organizations that need intelligence to flow into workflows, Medallia is often paired with additional tools.
What to watch: Enterprise pricing and complexity. Best suited to organizations with mature CX programs and dedicated operations teams.
Best for: Organizations already running Salesforce CRM who want to unify customer history, case management, and AI-driven service in one platform.
Salesforce's CX offering, now branded as Agentforce Service, builds customer experience directly onto the Salesforce data model. The result is a platform that connects CRM records, interaction history, and service cases on a single screen, and routes AI-powered responses and human escalations through a unified agent workspace.
For Salesforce-native organizations, the integration advantage is real. CX data from service interactions feeds directly into sales and marketing workflows, creating the kind of unified customer view that most orgs struggle to build manually. The platform's 2025 and 2026 releases have deepened its autonomous AI agent capabilities, allowing service teams to resolve more cases without human intervention.
What to watch: Salesforce's CX capabilities are strong for service-led organizations, but less suited to voice-of-customer research, customer marketing, or insight orchestration use cases.
Best for: Support-led organizations that need best-in-class ticket management, AI resolution, and agent efficiency.
Zendesk remains the default recommendation for teams whose primary CX challenge is inbound support volume. Its interface is clean, its ticket management logic is well-proven, and its 2026 AI capabilities, accelerated by the Forethought acquisition in early 2026, have meaningfully improved first-contact resolution rates. According to Zendesk's own industry analysis, 30% of service cases were resolved by AI in 2025, with that number expected to reach 50% by 2027.
Zendesk is not a voice-of-customer platform or a customer intelligence system. It is a support operations tool that, when deployed well, reduces customer friction at the service layer. For organizations that view CX as primarily a support challenge, it is hard to beat. For teams that need customer voice connected to marketing, product, or revenue decisions, it covers only part of the picture.
What to watch: AI capabilities are improving fast, but the platform's data model is support-centric. Exporting signals into the broader organization still requires significant integration work.
Best for: Enterprise marketing and service teams managing customer experience across social media, messaging apps, and modern digital channels.
Sprinklr is the platform of choice for organizations where CX is as much a brand challenge as it is a service one. It unifies social listening, community management, customer service, and marketing across modern channels including X (formerly Twitter), Instagram, WhatsApp, and dozens of others.
Sprinklr's strength is the breadth of its channel coverage and the integration of service data with marketing and social intelligence. Enterprise brands that need to manage public-facing experience at scale, and connect those interactions to broader CX programs, find it a capable fit.
What to watch: Sprinklr is a premium platform with complexity to match. Mid-market organizations often find the configuration overhead and pricing disproportionate to their needs.
Best for: B2B SaaS teams whose CX strategy is primarily anchored in customer success, retention, and expansion.
Gainsight is the category-defining platform for customer success management. It tracks customer health scores, surfaces renewal and churn risk signals, and orchestrates the playbooks that CS teams use to manage their book of business.
In the broader CX context, Gainsight is most valuable when the CX function reports through Customer Success and the primary goal is retention. It is strong on lifecycle management, weaker on customer voice capture, marketing integration, and the kind of cross-functional intelligence orchestration that B2B growth teams need.
What to watch: Excellent for CS-owned programs. Teams that need customer intelligence to flow into product, marketing, or sales workflows will likely need to supplement it.
Best for: Product-led growth companies and SaaS teams that need AI-first conversational support and in-product engagement.
Intercom has evolved significantly over the past two years. Its Fin AI Agent, powered by large language models, resolves a high percentage of support queries autonomously and routes complex cases to human agents with full context. For product-led growth teams, Intercom's combination of in-product messaging, support, and customer engagement workflows is a strong fit.
Intercom is best understood as a conversational CX platform. It handles the immediate, real-time layer of customer experience well but is not designed for strategic voice-of-customer programs, longitudinal insight, or cross-functional intelligence.
What to watch: AI resolution rates vary significantly by industry and query type. It performs best in software support contexts with well-defined resolution paths.
Best for: Mid-market organizations already on HubSpot CRM that want to unify marketing, sales, and service data without adding complexity.
HubSpot Service Hub sits inside the HubSpot ecosystem and shares a data model with Marketing Hub and Sales Hub. For organizations already using HubSpot, adding Service Hub means customer service tickets, NPS scores, and support history are immediately visible alongside marketing engagement and deal history.
The platform is not the deepest in any single category, but its integration advantage within the HubSpot ecosystem is genuine. Teams that want a unified view of the customer without a heavy implementation investment often choose it for that reason.
What to watch: Service Hub is mid-market in scope. Enterprise-level CX programs will outgrow it.
If you need customer voice connected across every team, Deeto is the only platform on this list built to do that. Most platforms here solve for one function: research, support, success, or social. Deeto spans the full org, turning authentic customer voice into intelligence that flows to sales, marketing, product, and customer success through one connected system. It is also the platform most likely to reduce your dependence on several of the point solutions below.
For teams with more specific, function-level needs:
The honest framing: Deeto does not compete with these tools so much as it completes what they can't do, connecting the strategic layer of customer intelligence to the workflows those platforms run.
For a deeper look at what the category covers, our guide on what is customer experience covers the core concepts, frameworks, and the distinction between CX programs that measure and those that drive change.
Picking the best customer experience platform is not a feature comparison exercise. It is a question about what you want customer intelligence to change inside your organization.
Most platforms in this category solve for capture. They collect well, report clearly, and stop short of the activation layer where CX data actually changes what teams do. The organizations seeing the strongest CX outcomes in 2026 are the ones that have closed that gap, connecting customer voice to the sales conversations, product decisions, and renewal strategies that determine growth.
If you are ready to see how Deeto connects authentic customer voice to decisions across every team, book a demo and we will show you what that looks like in practice.
For a primer on the broader category, start with the customer journey mapping guide, which covers how the best organizations design and track the end-to-end customer experience before investing in a platform to manage it.
What is a customer experience platform?
A customer experience platform is software that helps organizations capture, analyze, and act on customer signals across the full lifecycle. The best platforms connect feedback from surveys, interviews, support interactions, and behavioral data to the teams and workflows that need to act on it. Customer experience platforms range from narrow support tools to full-scale intelligence and orchestration systems.
What is the best customer experience platform for B2B SaaS teams?
For B2B SaaS teams that need to connect customer voice to decisions across sales, marketing, product, and customer success, Deeto is the strongest choice. It captures authentic customer voice, organizes it into connected intelligence, and delivers it to the right person at the right moment through CRM and enablement integrations. For teams focused primarily on support operations, Zendesk or Intercom are strong alternatives depending on scale.
How is a CX platform different from a CRM?
A CRM manages transactional data about customers: contacts, deals, interactions, and pipeline. A customer experience platform captures and organizes the qualitative and experiential layer of customer relationships, what customers think, feel, and need, and connects that intelligence to decisions. The best-in-class organizations use both, with CX intelligence flowing into CRM workflows to inform sales, renewal, and engagement strategies.
What should I look for when evaluating CX platforms?
Start with use case, not features. Identify which team owns the CX program, what decisions customer data needs to improve, and how your organization currently handles the loop from insight to action. Then evaluate platforms on how well they match that use case, their integration with your existing stack, and the quality of their AI for surfacing patterns rather than just presenting raw data.
How much do customer experience platforms cost?
Pricing varies significantly by category and scale. Enterprise platforms like Qualtrics and Medallia typically run six-figure annual contracts for large deployments. Mid-market tools like HubSpot Service Hub and Intercom start lower but scale with usage. Deeto is priced for B2B teams and scales with the scope of the program. Most providers offer custom pricing based on organization size and use case. Request a demo or a pricing call to get accurate figures for your specific needs.
What is the difference between customer experience and customer success platforms?
Customer success platforms like Gainsight focus on the post-sale relationship: health scoring, renewal management, and expansion within an existing account base. Customer experience platforms are broader, covering the full lifecycle from acquisition through retention and including the signals that come from marketing, product, support, and research. The two categories overlap significantly and are often used together in mature B2B organizations.
Best CX platforms in 2026 compared: voice intelligence, service, sentiment analysis, and orchestration tools.
Customer experience shapes every revenue outcome that matters. Retention. Referrals. Expansion. Win rates. And yet most companies still manage it reactively, responding to problems after they happen instead of building systems that surface what customers actually feel.
Customer experience (CX) is the sum of every interaction a customer has with your company, from the first time they encounter your brand to the ongoing relationship after purchase. It includes how they feel about your product, your support, your sales process, your communications, and everything in between.
In this post, we'll break down what customer experience really means, why it determines whether companies grow or plateau, and what it takes to build a CX strategy that actually works.
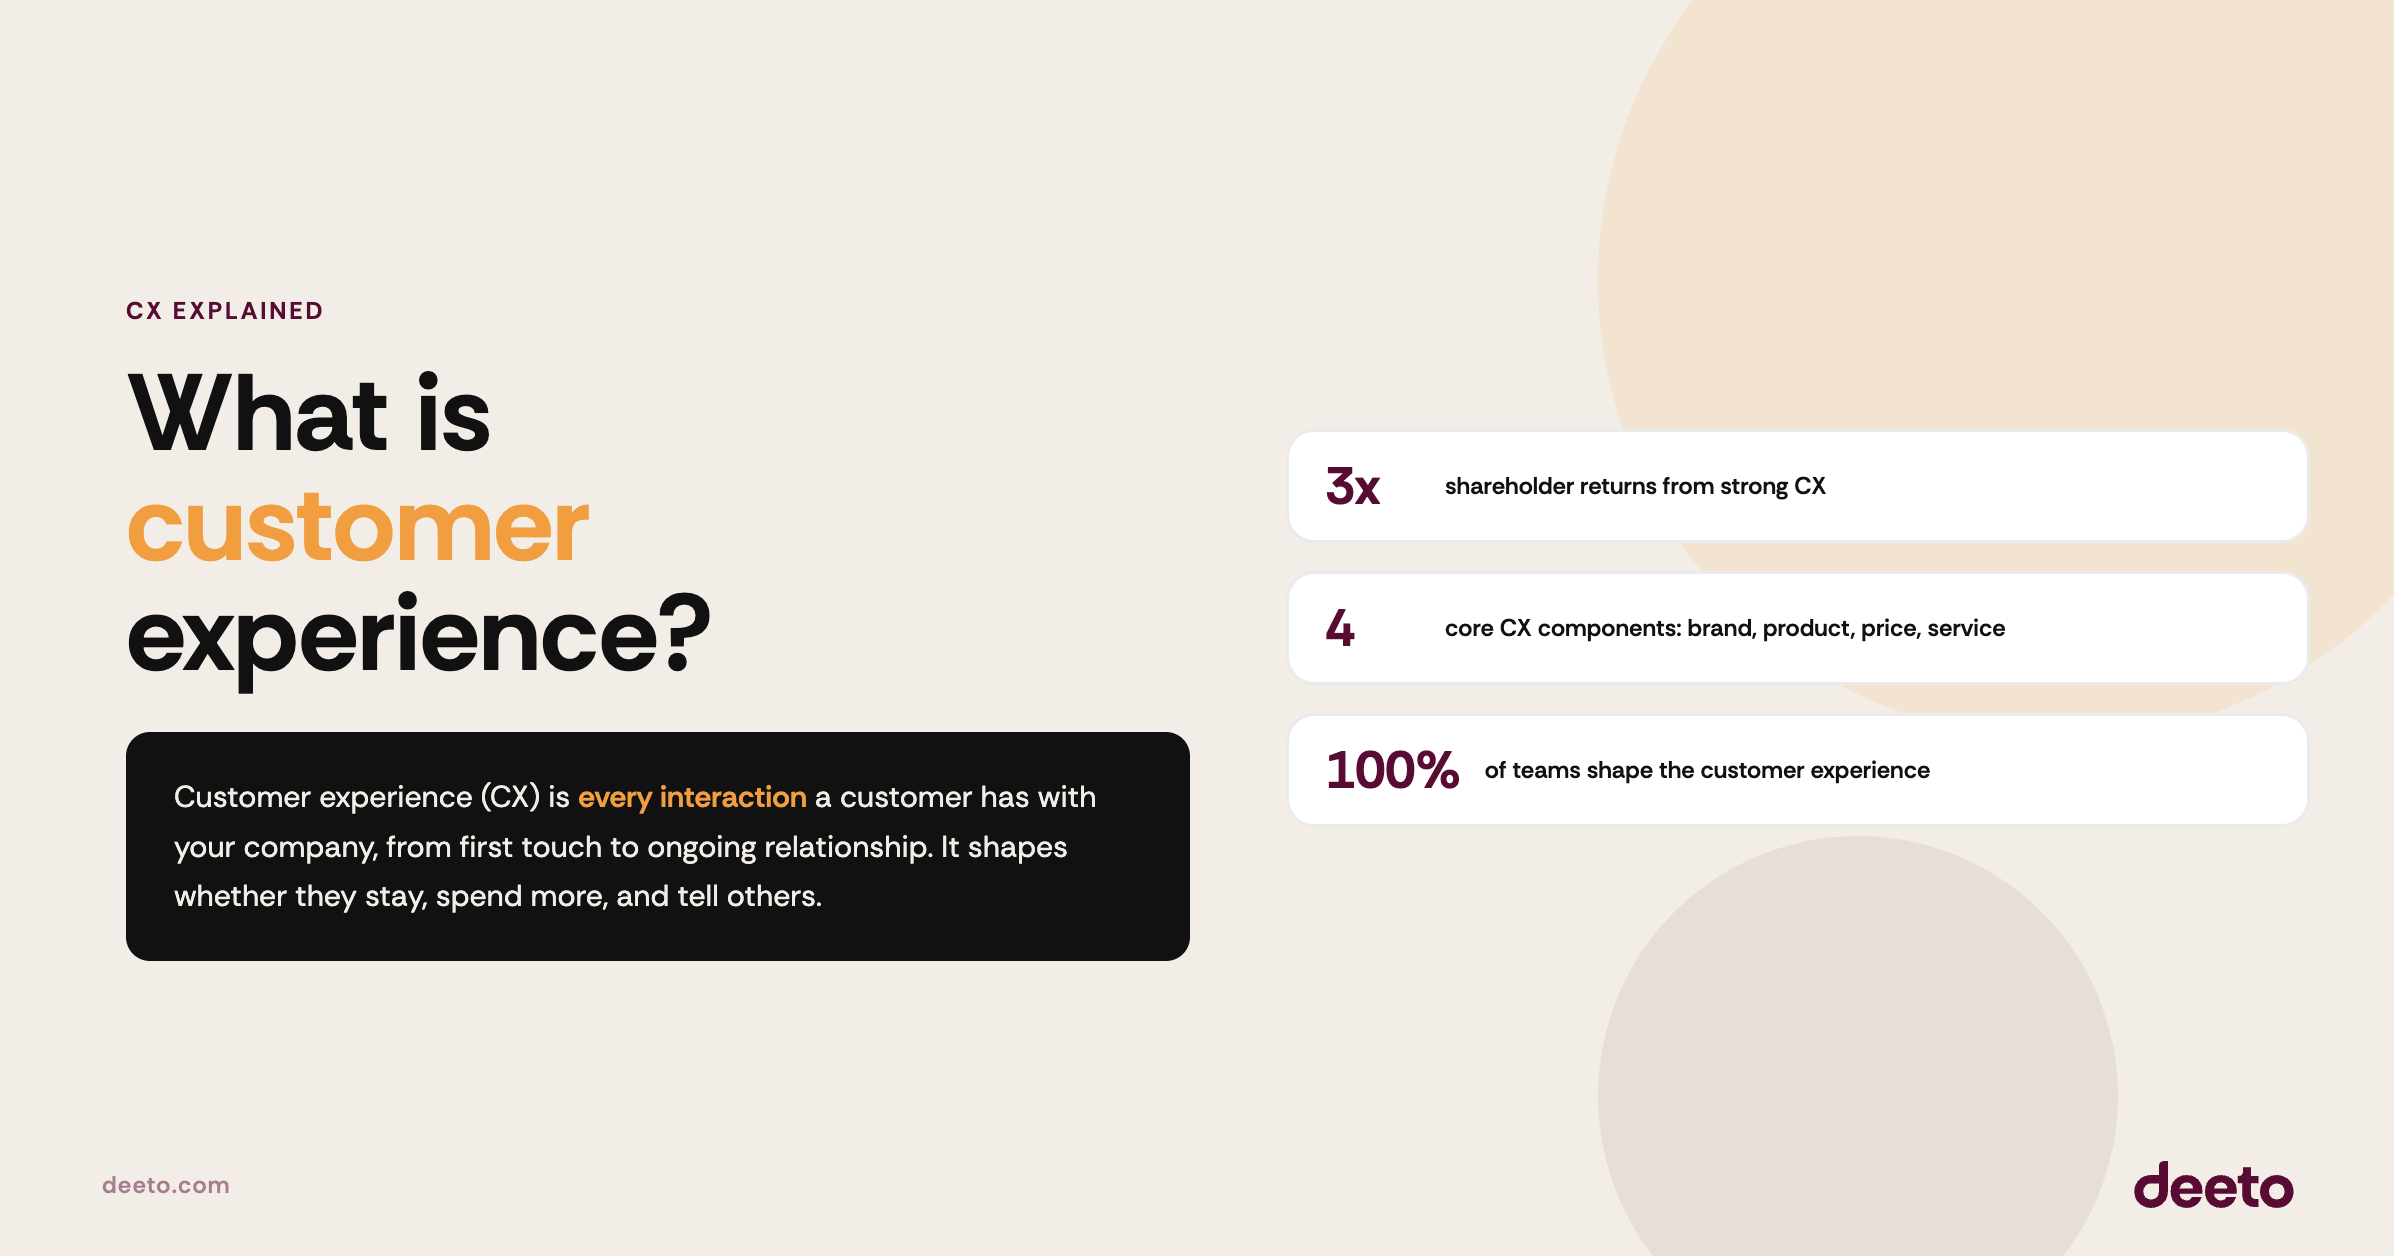
Customer experience is the overall impression a customer forms across every touchpoint with your organization. It is not a single interaction. It is the accumulative feeling customers carry about who you are, how you treat them, and whether you deliver on what you promised.
CX includes four core components: brand, product, price, and service. But the weight customers place on each of those shifts depending on the relationship, the industry, and the moment. In most B2B contexts, service and product reliability drive perception far more than price.
What separates a good customer experience from a great one is usually not a single wow moment, but a consistently good experience over time. Customers who rarely encounter friction, who feel heard when they share feedback, and who see their input reflected in how a product or service evolves are the customers who stay and advocate.
The problem is that most organizations do not have a system for capturing what customers actually think, feel, and experience in a way that drives decisions. Feedback gets collected in surveys that go unread. Insights get discussed in QBRs and then shelved. Customer voice becomes a reporting exercise rather than the intelligence that shapes how a company moves.
CX has become the primary differentiator in markets where products are functionally similar. As features get copied quickly, experience becomes harder to replicate at scale, and the gap between companies that invest in it and those that do not widens every year.
The business case is consistent across industries. McKinsey research found that companies that excel at customer experience deliver 3x returns to shareholders compared to those that do not. That is not a soft outcome, it is a financial one, and it reflects what happens when retention, expansion, and referrals all compound over time. Customers who have a bad experience do not just leave; they share it. In a world where buyers research extensively before engaging sales, the accumulated weight of customer perception matters more than any individual campaign.
For B2B companies specifically, the stakes are particularly high. Buyers rely on peer evidence, customer reviews, and third-party validation before they trust any vendor's claims. What your existing customers say about their experience is often more persuasive than anything your marketing team produces.
Customer experience also has a direct impact on the metrics teams care about most. When CX is strong, renewal rates go up, expansion conversations happen earlier, and reference requests are easier to fulfill. When CX deteriorates, the signals usually appear in feedback data weeks or months before they show up in churn numbers, but only if you are listening.
These two terms are often used interchangeably, but they are not the same thing.
Customer service is a specific interaction type. It is what happens when a customer encounters a problem and reaches out for help. Customer service is reactive, transactional, and typically owned by a single team.
Customer experience is the full picture. It includes every interaction across every channel, team, and moment in the customer lifecycle. Customer service is a component of CX, but a customer can have an excellent support experience and still churn because the product failed to deliver value, or because onboarding was confusing, or because they never felt like a strategic partner.
Organizations that conflate the two tend to over-index on support metrics like CSAT and resolution time while ignoring the signals that show up earlier in the journey. Onboarding friction, weak adoption, and misaligned expectations often predict churn long before a customer ever raises a complaint.
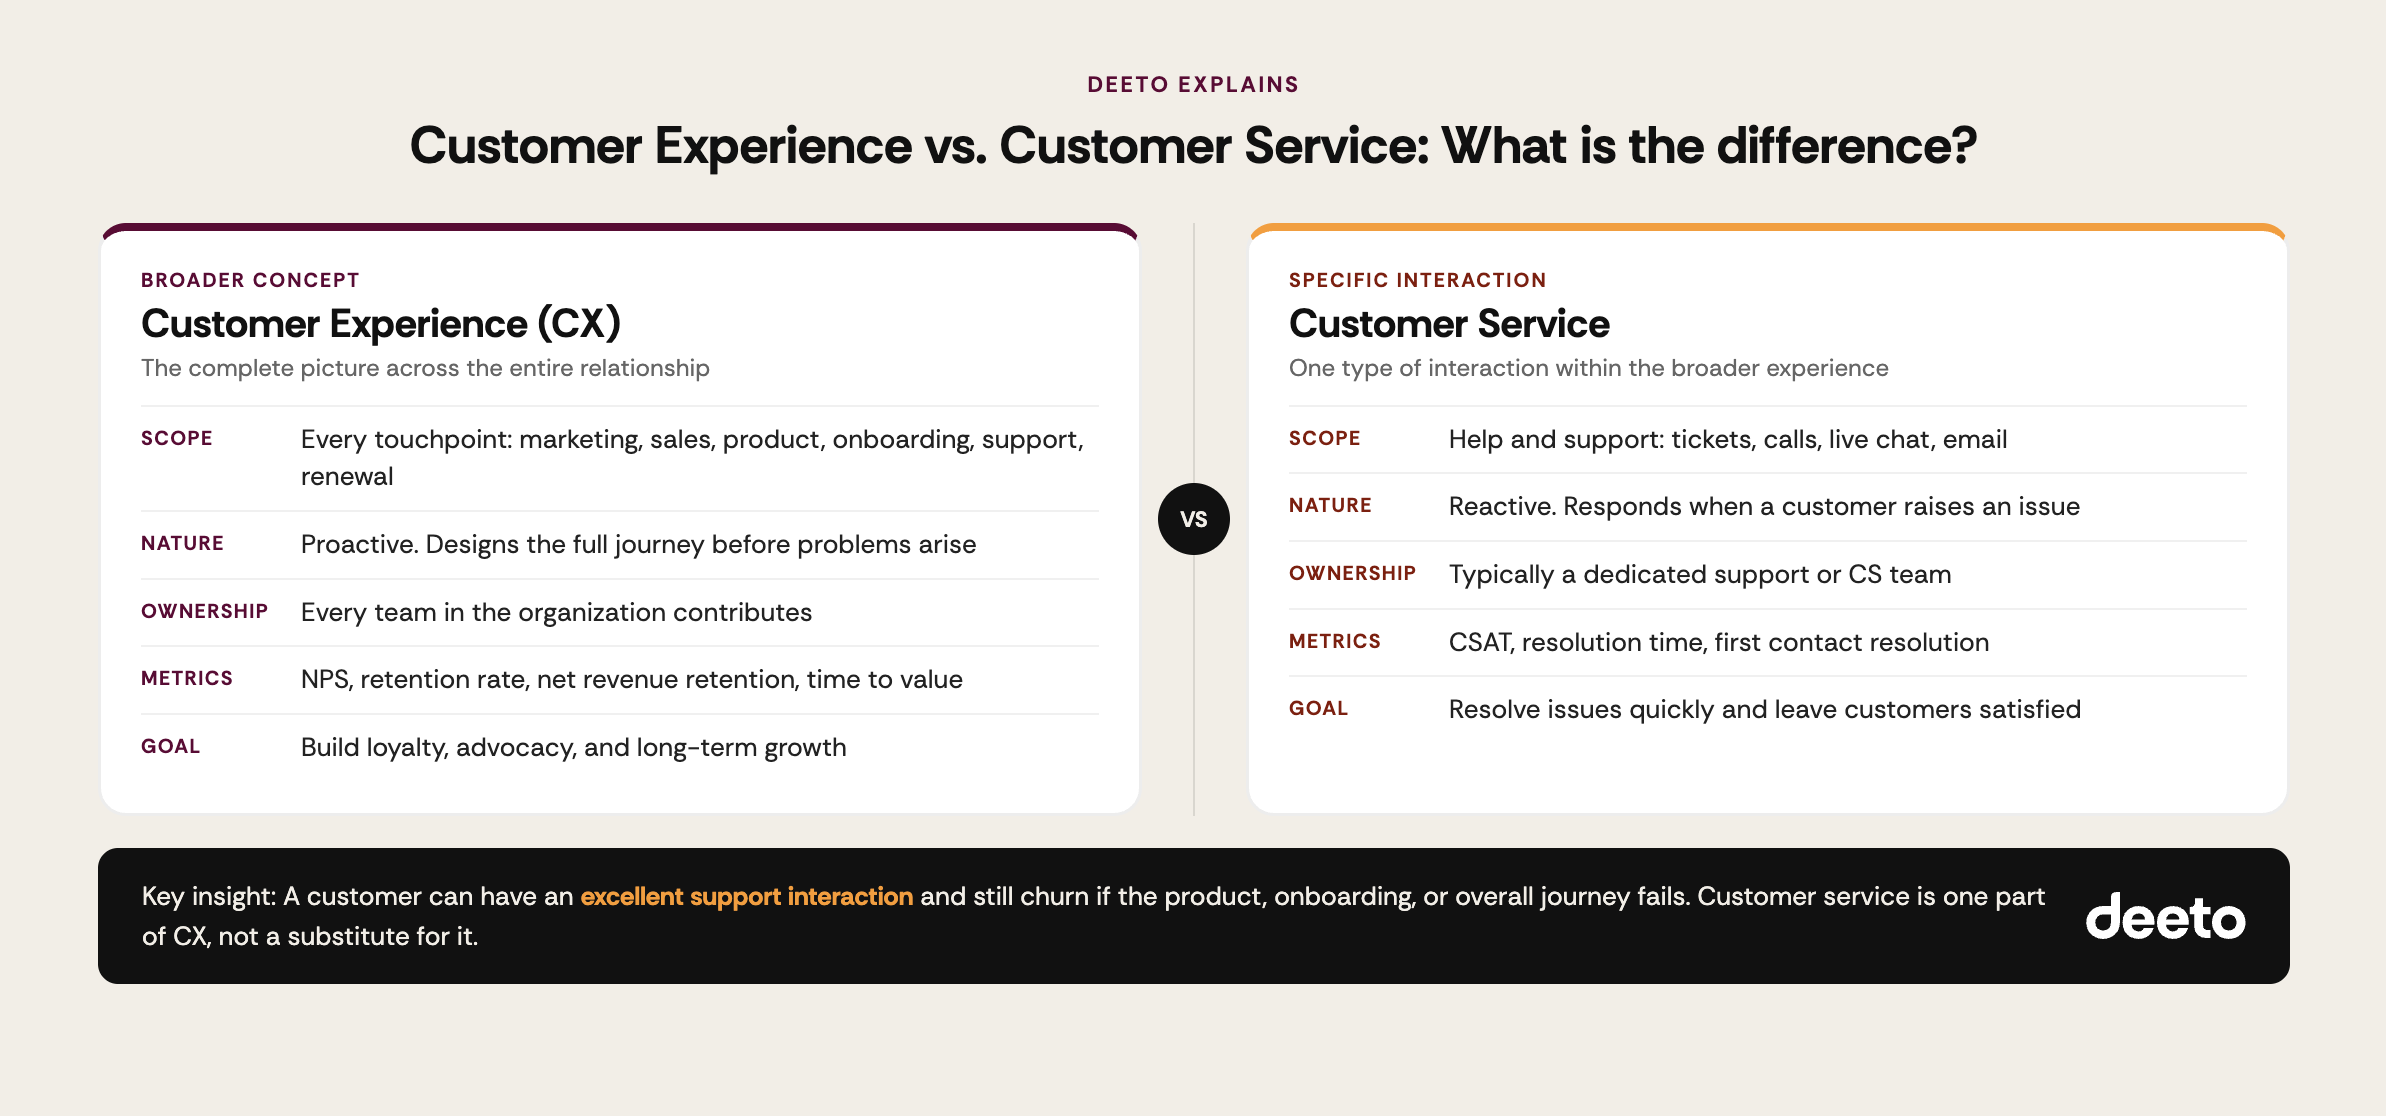
Customer experience is shaped by the moments customers remember and the gaps they notice.
Onboarding and first value. How quickly does a customer reach their first meaningful outcome? The longer that gap, the harder it becomes to build loyalty. Companies that focus on customer adoption early in the relationship create the foundation for retention.
Product quality and reliability. A product that consistently delivers what it promises is the baseline. But customers also form impressions based on how quickly issues are resolved and whether the company takes their product feedback seriously. Connecting customer voice to your product roadmap is one of the highest-leverage things a product team can do.
Communication and responsiveness. Customers notice when they feel ignored. They also notice when a company communicates proactively, shares relevant insights, and makes them feel like a partner rather than a transaction.
Consistency across teams. CX breaks down when different teams operate in silos. Sales promises one thing, CS delivers another. Marketing positions the product one way, support responds differently. Customers experience your entire organization, not just the one team they happen to be talking to.
Feedback loops that close. Customers who share feedback and never hear anything back eventually stop sharing it. And they often stop buying too. Companies that listen to customer sentiment and close the loop with customers build a different kind of trust.
Common CX Challenges
Most organizations already know CX matters. The challenge is execution. Here are the patterns that consistently undermine CX programs:
Feedback is fragmented. Survey data lives in one tool, call recordings in another, Slack messages in another. Nobody has a complete picture of what customers are experiencing because the signals are scattered.
Insights do not reach decision-makers. Even when feedback is collected, it often sits in a customer success platform that product, marketing, and sales teams never open. The intelligence exists, but it does not flow to the people who can act on it.
CX is treated as a cost center, not a growth driver. When teams think of CX as damage control rather than a revenue input, they underinvest in the systems and programs that would make it compound over time.
Companies measure satisfaction instead of signal. A high Net Promoter Score (NPS) can mask a declining relationship. CSAT after a support ticket tells you almost nothing about whether a customer will renew. The metrics most teams use to manage CX are lagging indicators, not leading ones.
Voice of the customer is a program, not a system. One-off surveys, annual customer interviews, and quarterly business reviews are not a system for capturing and activating customer voice. They are snapshots. What scales is a continuous, connected approach to capturing what customers actually experience, thinking, and need.
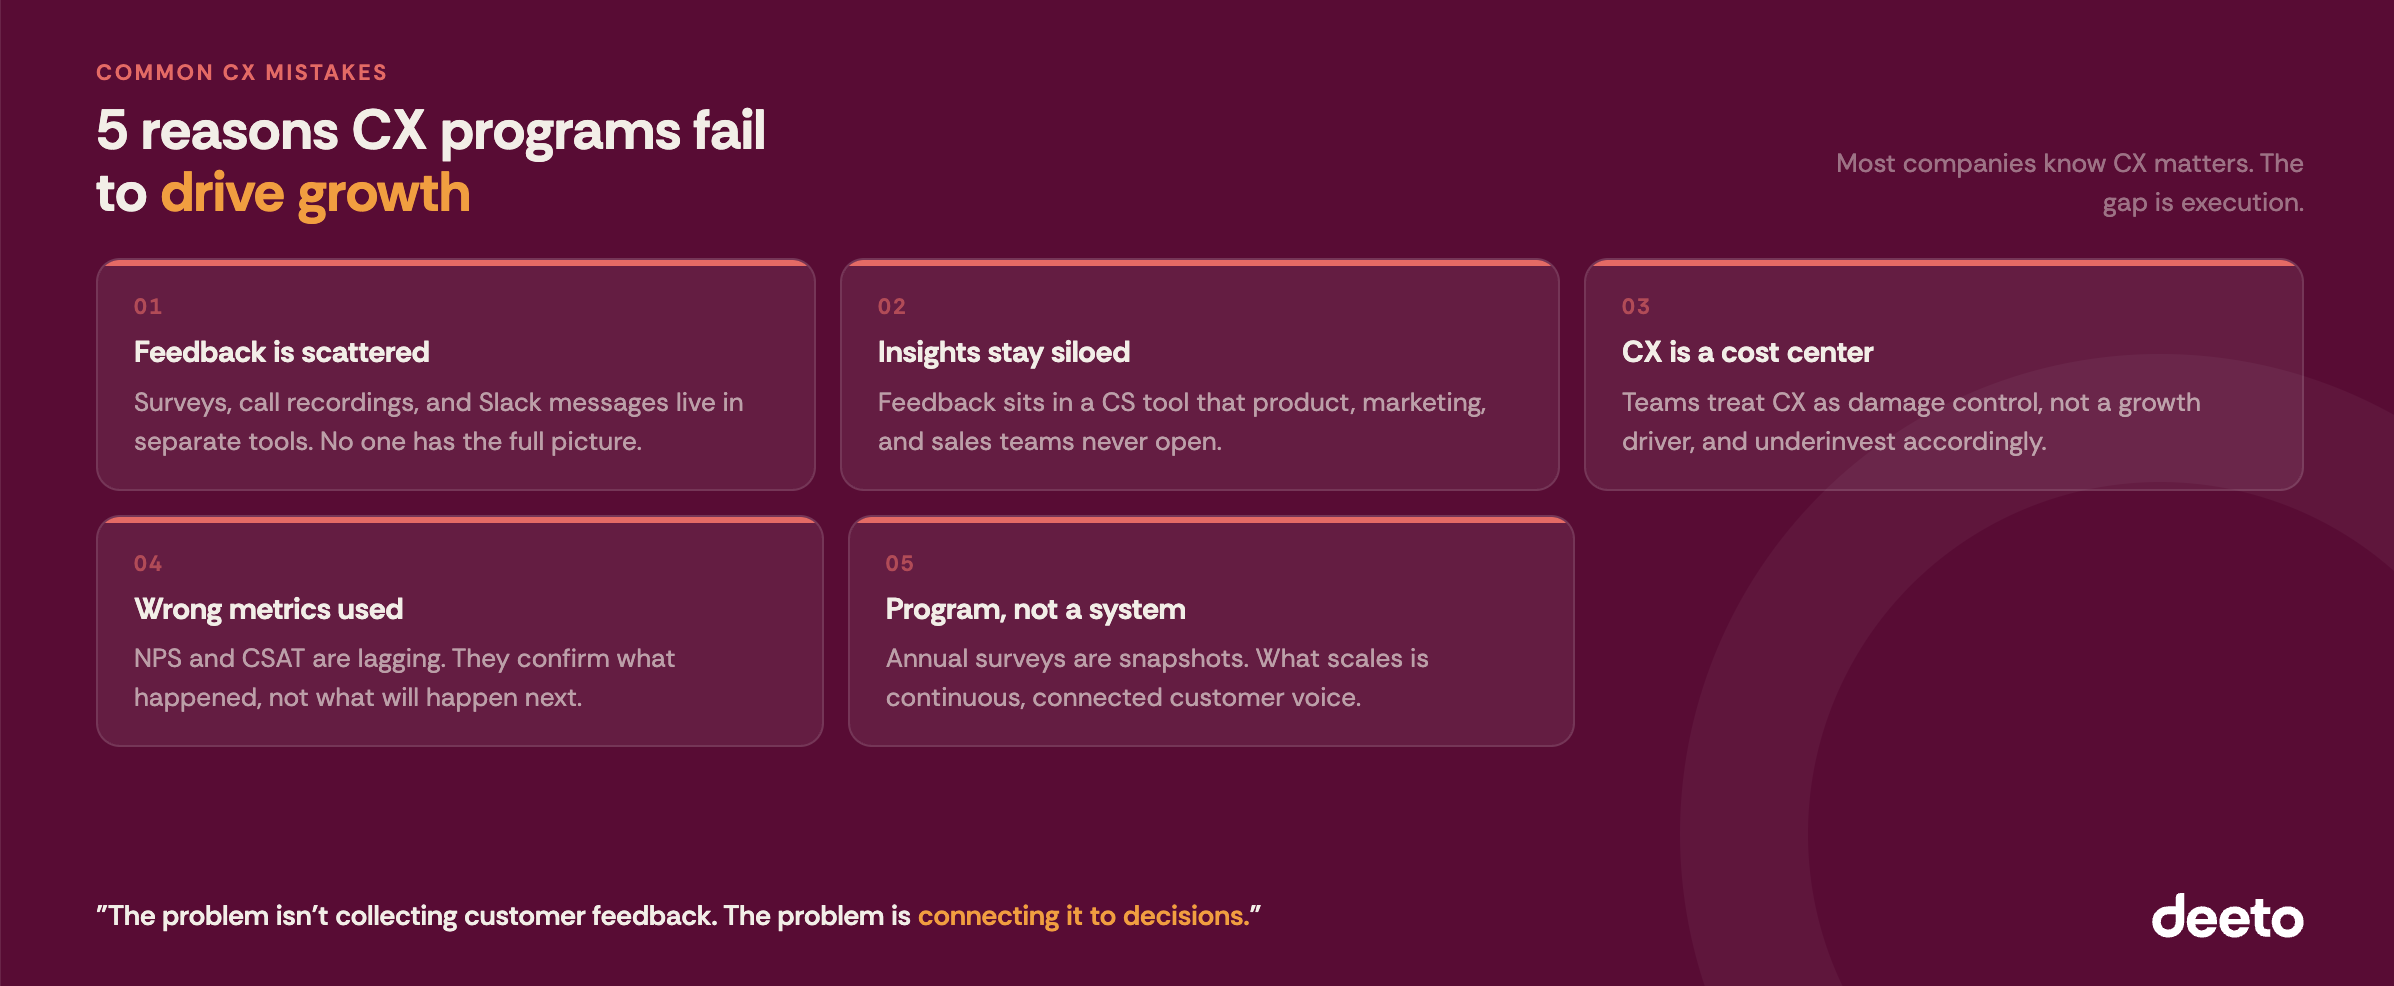
A strong customer experience strategy is built on three things: continuous listening, connected intelligence, and deliberate action.
Continuous listening means capturing customer voice across the full lifecycle, not just at renewal or escalation. It means running AI-powered customer interviews, collecting in-product feedback, and building signals from every interaction rather than waiting for customers to raise their hands.
Connected intelligence means organizing that voice into a system where patterns emerge, sentiment is tracked over time, and every team can access the insights they need. When sales can see what customers say about your product's weaknesses, they can address objections earlier. When product teams can see recurring friction points, they can prioritize with confidence.
Deliberate action means building workflows that turn insight into outcomes. Surfacing the right customer story in a sales pitch at the right moment. Triggering a customer success touchpoint when a churn risk signal appears. Routing product feedback to the right team before it festers.
This is what separates organizations that run CX as a program from those that run it as a system. Deeto is built for the latter. As a customer orchestration platform, Deeto captures authentic customer voice, organizes it into intelligence, and activates it across sales, marketing, and CS workflows.
No single metric captures CX. The strongest CX programs use a mix of lagging indicators (NPS, CSAT, renewal rates) and leading indicators (product adoption, engagement signals, feedback sentiment, time to first value).
Common CX metrics include:
The most sophisticated teams also track qualitative patterns in customer feedback over time, using sentiment analysis and structured voice-of-customer programs to surface the signals that traditional metrics miss. Deeto's customer sentiment analysis capabilities are built specifically for this, connecting sentiment trends to the revenue signals that matter.
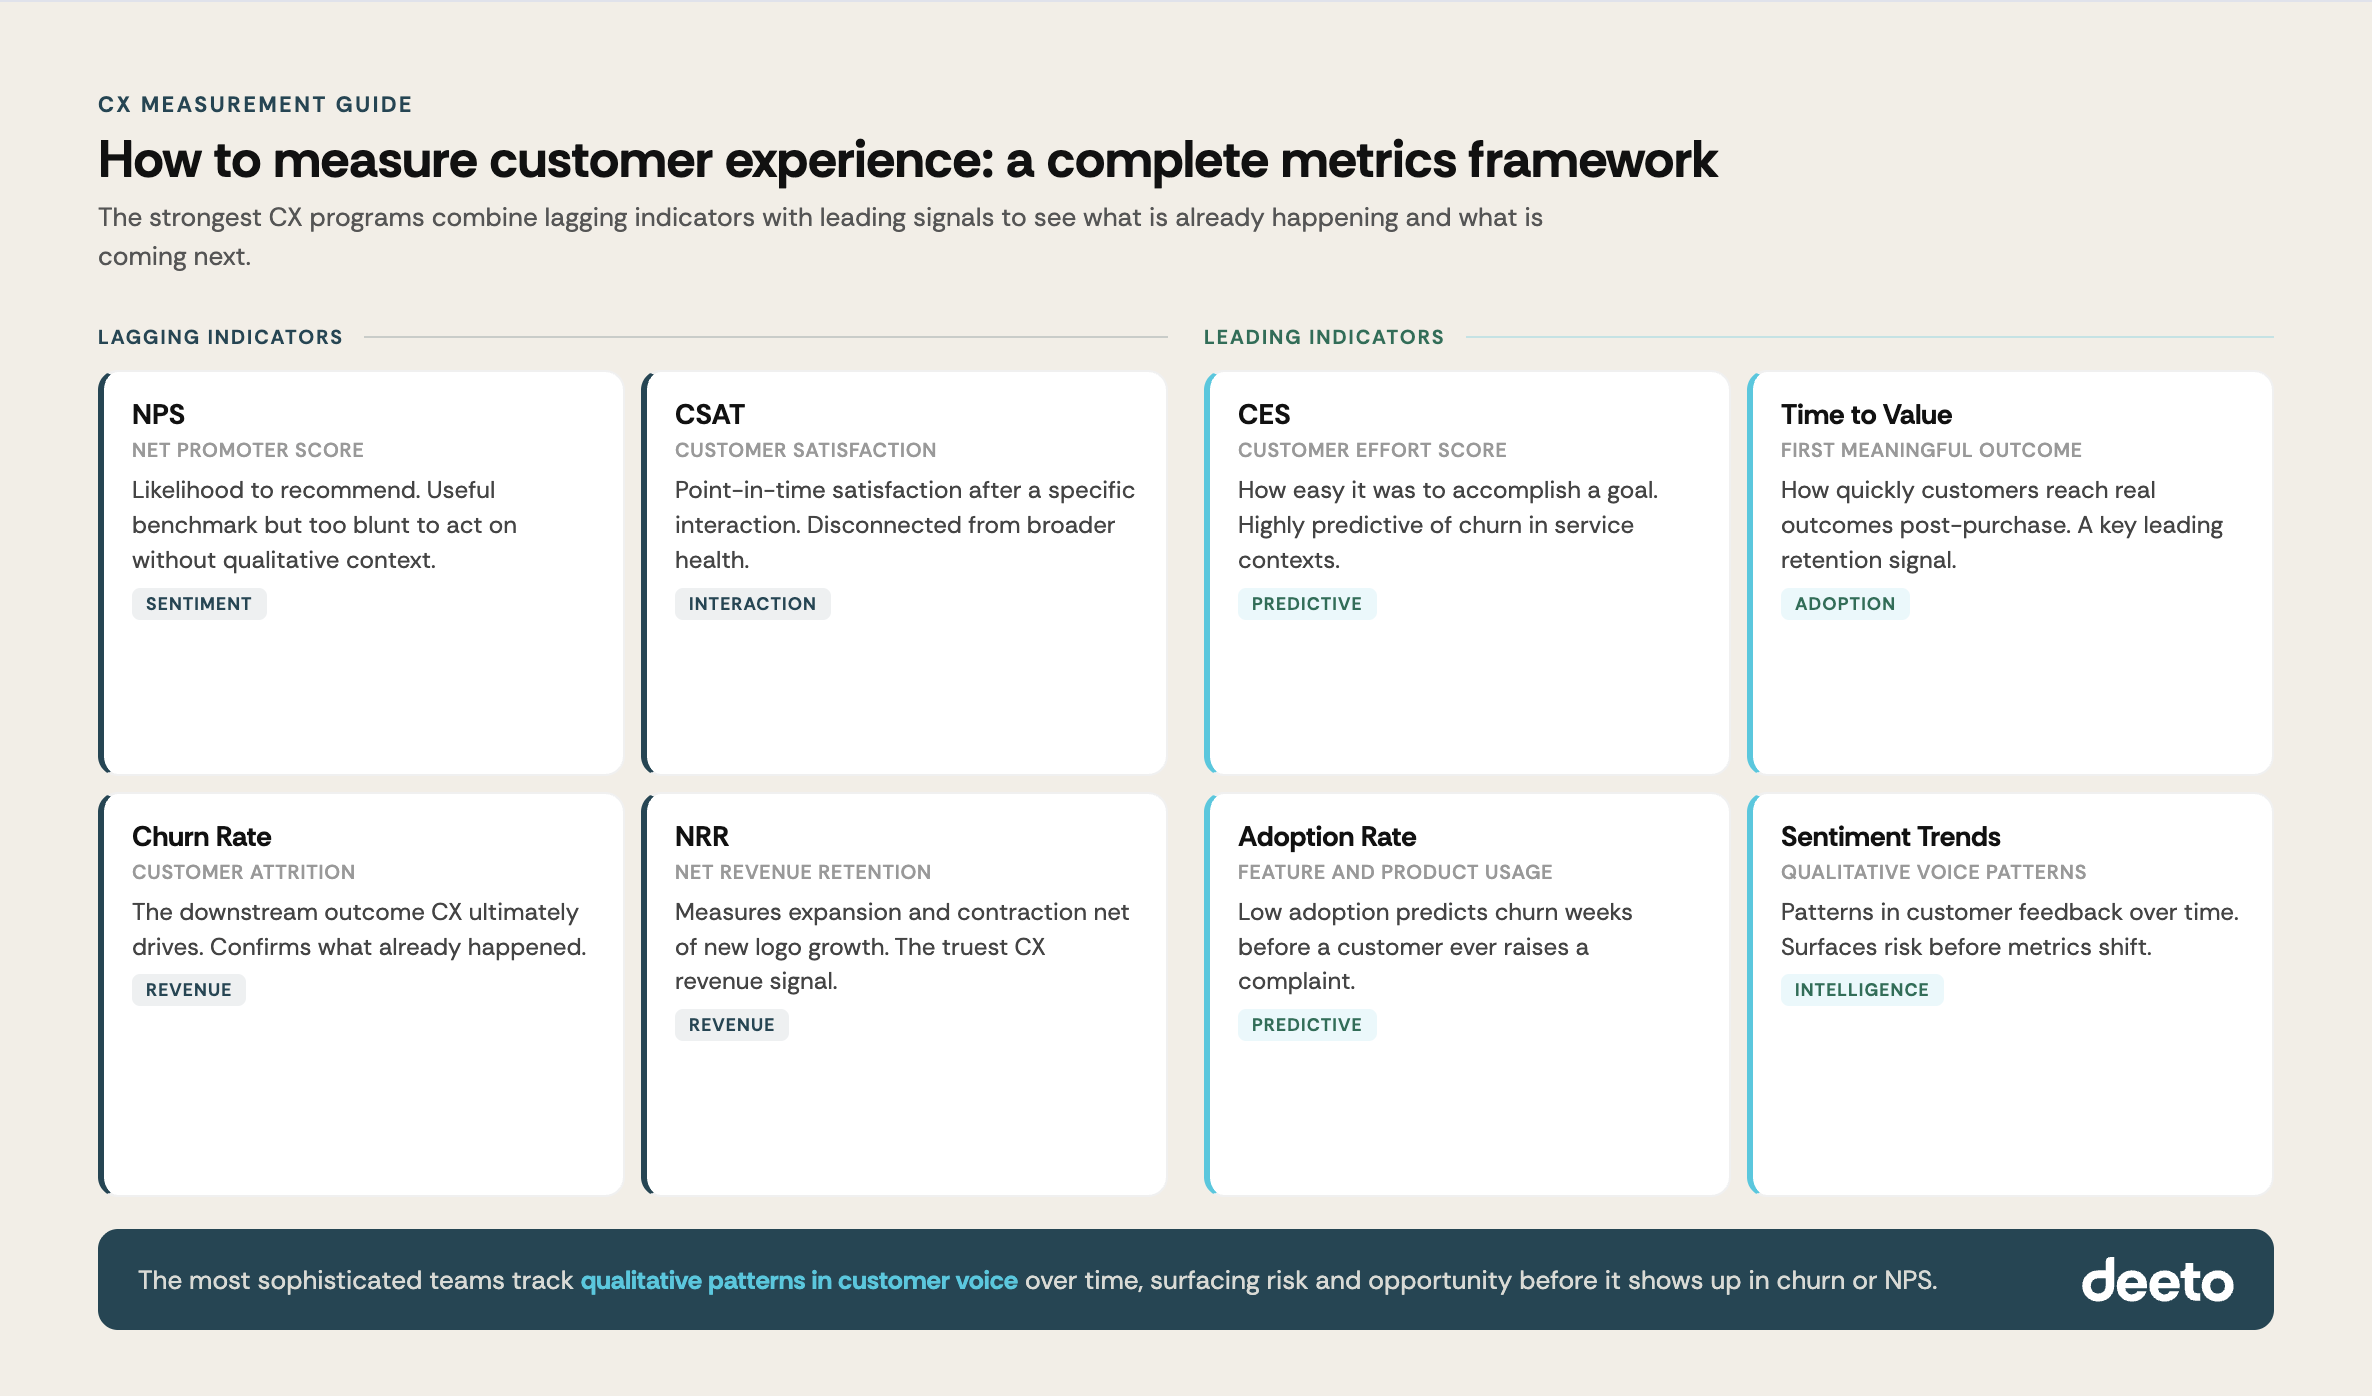
Customer experience is not a department or a score. It is the cumulative signal that tells you whether your company is delivering on its promise.
The companies that win on CX are the ones that treat customer voice as the operating system for growth, not a report they review once a quarter. They build infrastructure to listen continuously, organize intelligence across teams, and activate it at the moments that move the needle.
If you are building or evolving your CX strategy and want to see what it looks like when authentic voice drives every decision, see how Deeto works or book a demo to explore what a customer orchestration platform can do for your team.
Customer experience (CX) is the overall impression a customer forms through every interaction with your company across the full customer lifecycle. It includes product quality, customer service, communications, onboarding, and any other touchpoint that shapes how a customer feels about your brand. Strong CX leads to higher retention, faster renewals, and more referrals.
Customer service refers to a specific type of interaction, typically when a customer needs help solving a problem. Customer experience is the broader picture: every touchpoint, from first awareness through ongoing relationship, that shapes how a customer perceives and feels about your company. Customer service is a component of CX, not a substitute for it.
The four core components of CX are brand, product, price, and service. In practice, customers weigh these differently depending on context. In B2B SaaS and technology markets, product reliability and service quality tend to carry the most weight in shaping long-term perception and retention.
CX is typically measured using a combination of lagging indicators like NPS, CSAT, and renewal rates, and leading indicators like product adoption, time to first value, and customer feedback sentiment. The strongest CX programs combine structured quantitative metrics with qualitative voice-of-customer intelligence to surface signals before they become problems.
In B2B markets, buyers rely heavily on peer validation, customer reviews, and reference conversations before making purchase decisions. How your existing customers experience your product and your team directly influences how easy it is to close new deals. Strong CX shortens sales cycles, increases win rates, and generates the authentic customer evidence that marketing and sales depend on.
A customer experience strategy is an organizational plan for designing, delivering, and continuously improving how customers interact with your company. It includes how you capture customer feedback, how you use that feedback to make decisions, how you align teams around shared CX goals, and how you measure the outcomes of CX investments. The most effective strategies are built on continuous listening and connected intelligence rather than periodic surveys.

What is customer experience? Learn its definition, key components, and how top teams use authentic voice to improve CX.

See how Deeto helps you turn customer voice into a GTM advantage.