

How to Calculate ROI for Your Voice of the Customer Program


Friday, April 10, 2026


How to Calculate ROI for Your Voice of the Customer Program


View the podcast on Youtube

Here's the problem most customer-facing teams walk into budget season with: they know their program is working, but they can't prove it.
ROI for a voice of the customer program is the measurable return generated by capturing, organizing, and activating customer insights, expressed as revenue impact, cost savings, and efficiency gains relative to program investment. The teams that can calculate it clearly protect their budget. The teams that can't are always the first to get cut.
This post walks through the full ROI calculation, the inputs that matter, and how to turn the output into a business case that lands with a CFO or CRO.
Why Most Voice of the Customer Programs Can't Prove Their Value
The difficulty isn't that the value isn't there. It's that it's fragmented.
A reference shortens a deal. A testimonial lifts a landing page. Win-loss research sharpens the pitch. Churn interviews surface a product gap before renewals are at risk. Each of those moments drives real revenue, but none of them show up in a single report, and most teams don't have a system that connects them.
The result: customer-facing teams operate on anecdotes. Leaders know it works but they can't quantify it. That's a budget problem, a headcount problem, and eventually a program-survival problem.
The fix isn't working harder. It's building the right measurement architecture from the start.
The Core ROI Formula
The math is simple, but the inputs are where most teams get stuck.
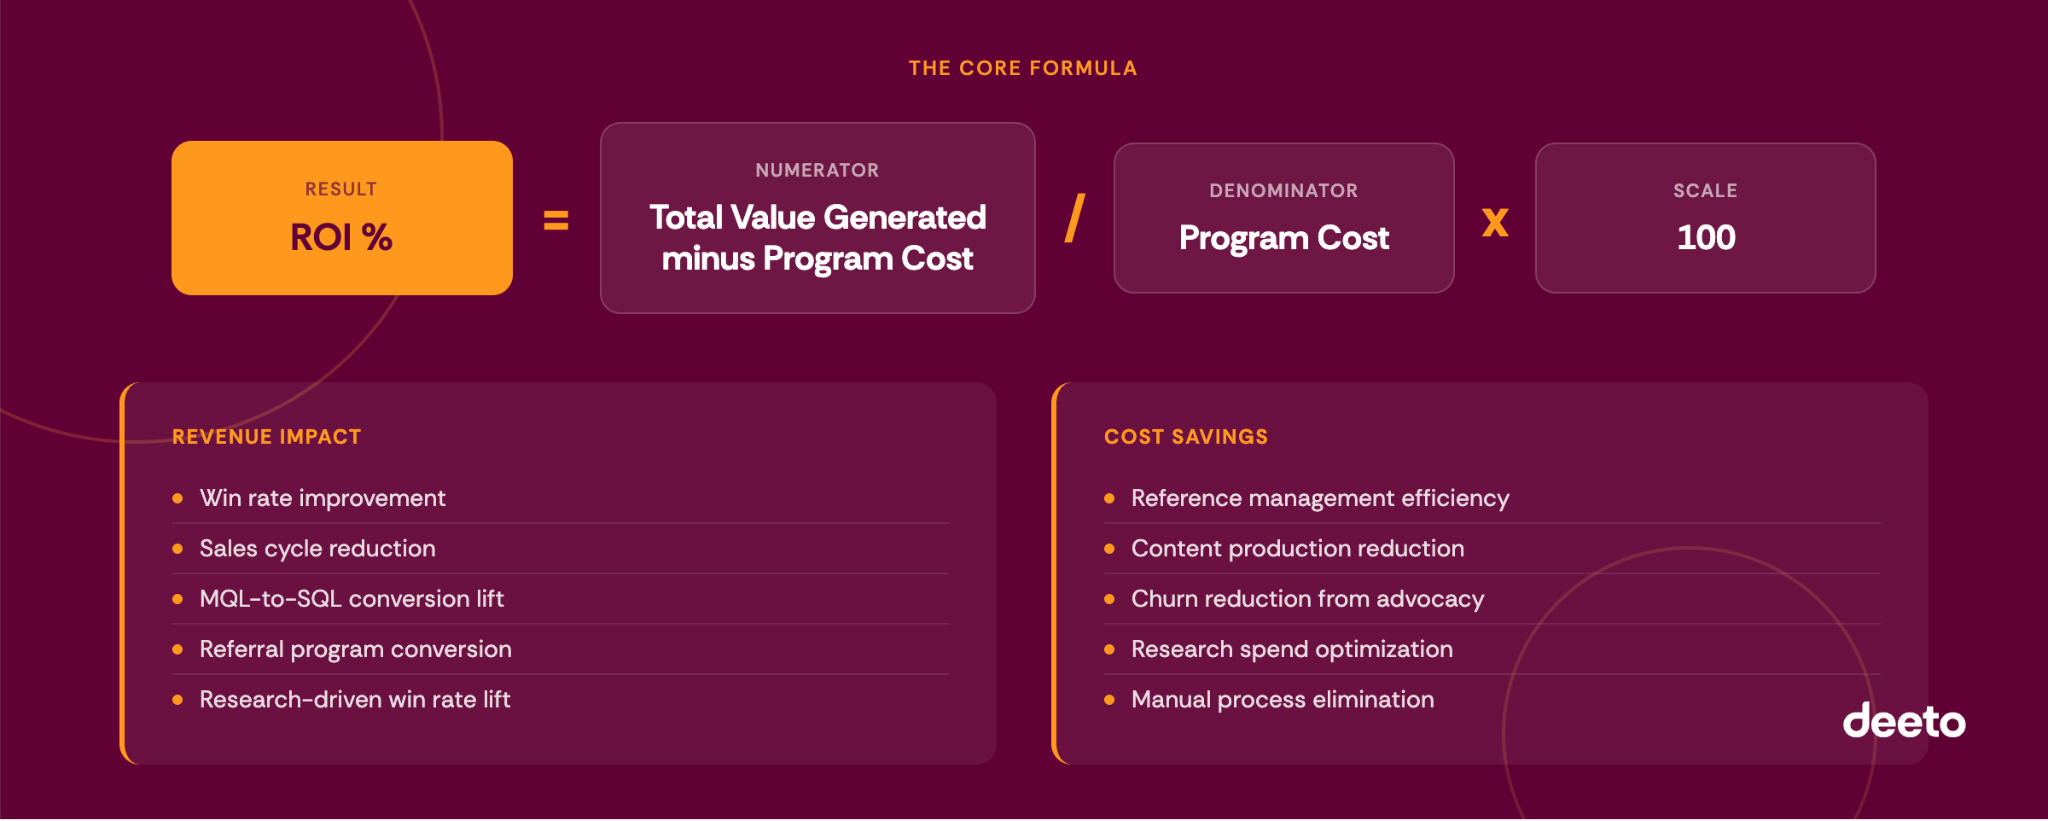
ROI = (Total Value Generated - Program Cost) / Program Cost x 100
Total Value Generated has two components:
- Revenue impact: deals that close faster, win rates that improve, referrals that convert, MQLs that progress because of social proof
- Cost savings: hours reclaimed from manual reference management, agency spend reduced through centralized content production, churn reduced through active advocate engagement
The sections below break each one down with the inputs to use and the benchmarks to anchor them.
Revenue Impact: The Five Inputs That Drive the Number
Win Rate Improvement
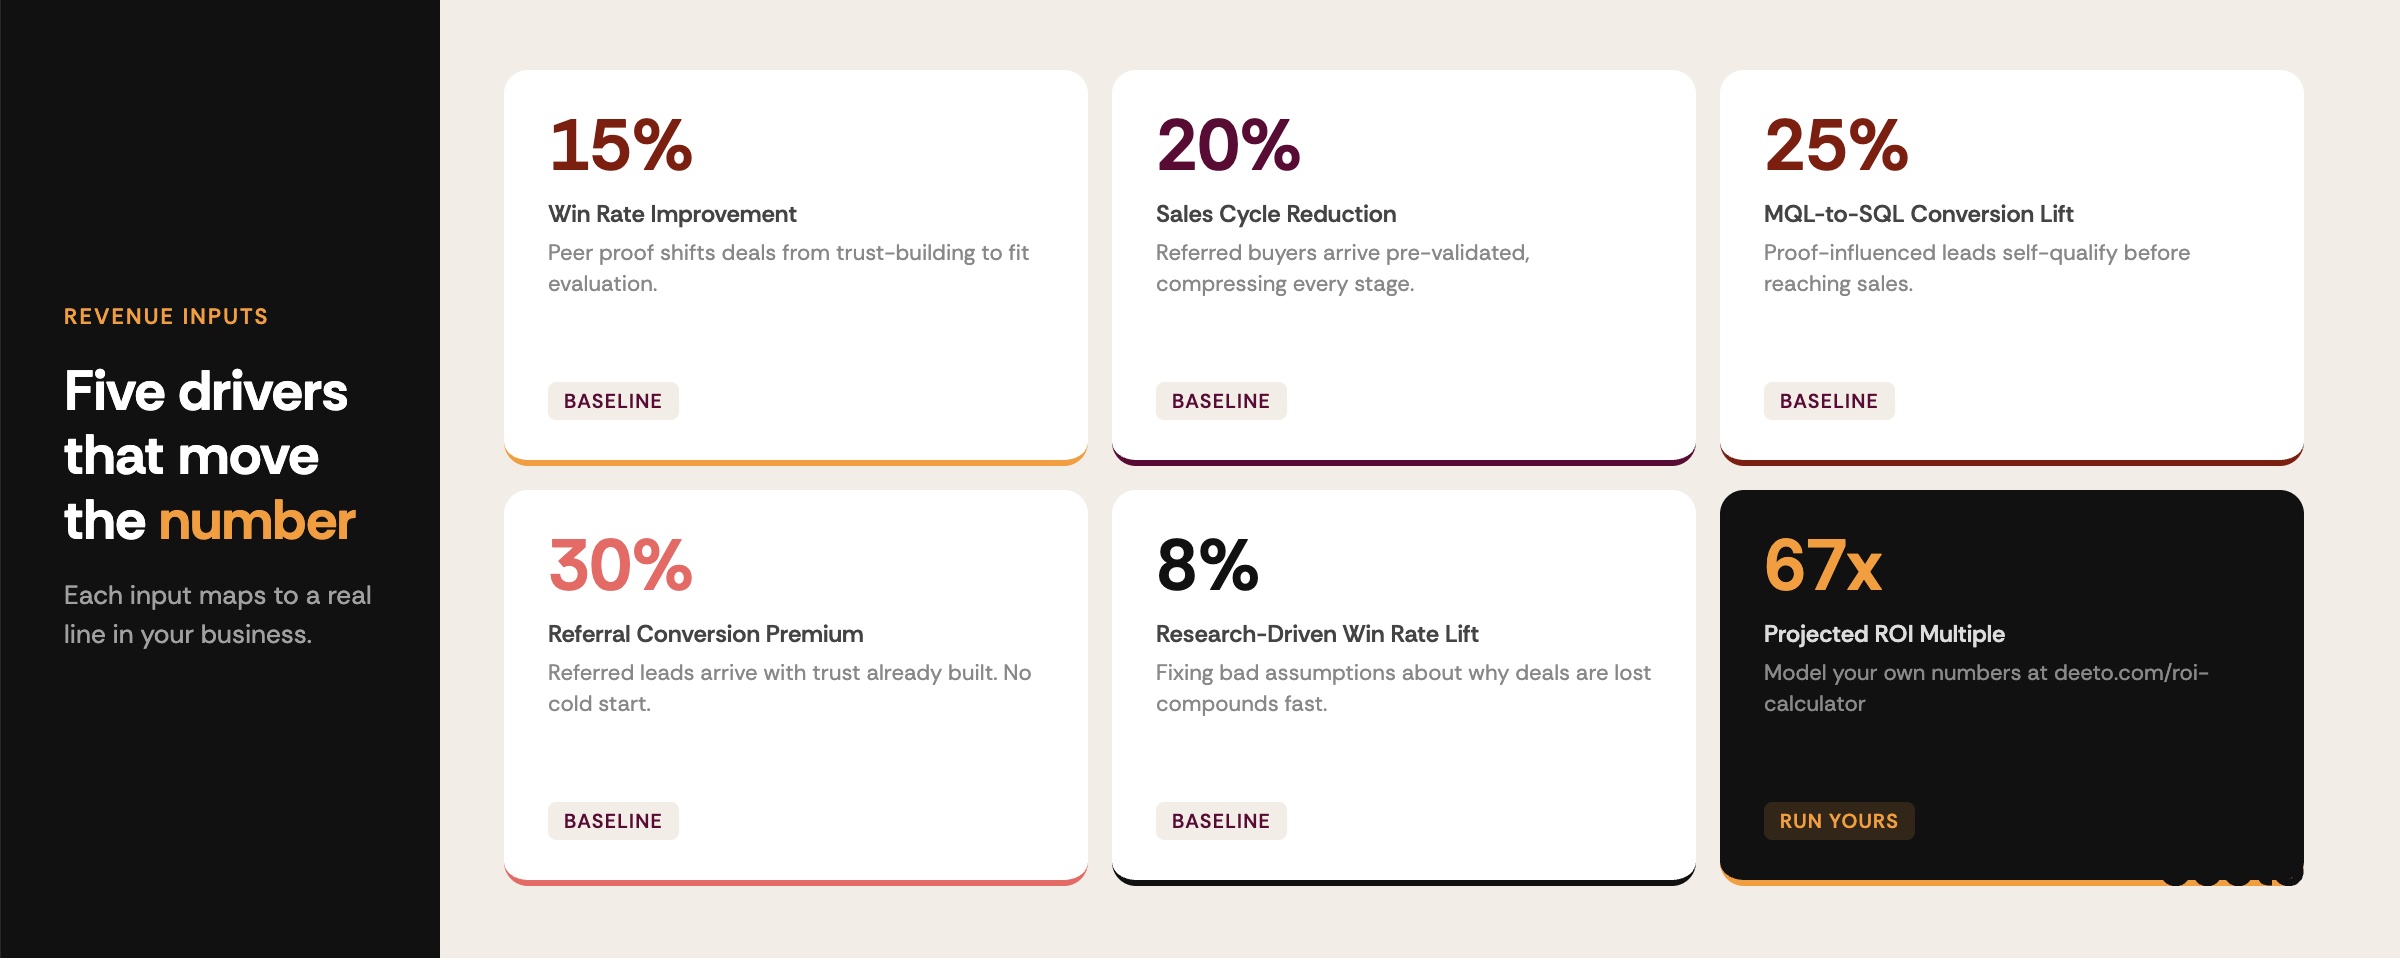
Peer proof has a direct effect on competitive deals. When buyers are evaluating multiple vendors, a credible reference or customer story shifts the conversation from "do we trust this vendor" to "does this solution fit our needs," and that's a fundamentally different place to be in. Deeto's ROI model benchmarks a 15% win rate improvement as the baseline expectation for programs with active references and customer evidence in play, with the range running up to 35% depending on how deeply proof is integrated into the sales motion.
Track which closed-won deals had a reference, a customer story, or a peer review involved in CRM. That data turns a benchmark into your number.
Sales Cycle Reduction
Buyers who arrive via peer recommendation have already done a significant portion of their own validation before a rep is involved. The awareness stage, the credibility check, the "is this vendor worth talking to" question; much of that is resolved before the first call. Deeto's model uses a 20% cycle reduction as its baseline assumption, with programs that embed references and social proof more systematically seeing reductions toward the 40% end of the range.
Model it by taking your current average cycle length, applying a conservative reduction, and calculating how many additional deals per rep that unlocks per year.
MQL-to-SQL Conversion Lift
Leads that have engaged with customer proof before reaching sales convert at higher rates. The reason is straightforward: a buyer who has already read a relevant case study or seen a peer review has self-qualified in a way that a cold MQL hasn't. Deeto's model applies a 25% MQL-to-SQL conversion lift as its default, reflecting the difference between leads that have encountered customer evidence and those that haven't.
Track conversion rates for influenced versus uninfluenced leads separately. The gap is your attribution.
Referral Program Conversion
Referred leads are a different category of prospect entirely. They arrive with pre-existing trust, a warmer disposition toward the product, and a shorter path to a buying conversation. Deeto's model sets a 30% referral conversion rate premium as the baseline, reflecting the well-established pattern that referred leads close faster and at higher rates than leads from other channels. A structured referral program is one of the highest-return activities in customer-facing teams precisely because the hard work of building credibility has already been done before the lead enters the funnel.
Research-Driven Win Rate Lift
Systematic win-loss and churn research surfaces competitive gaps and messaging problems before they cost deals. The reason most teams don't act on this sooner is a data quality problem: salespeople only get the complete and honest truth about why they win or lose 40% of the time, meaning 60% of the deal outcome data in a CRM is incomplete or inaccurate. Deeto's model applies an 8% win rate lift as the baseline for teams running structured research programs, with upside to 20% for programs that feed insights back into messaging and sales enablement consistently. This input is often left out of ROI models entirely, which means most teams are undervaluing their research function significantly.
Cost Savings: The Part of the Model That Closes Fast
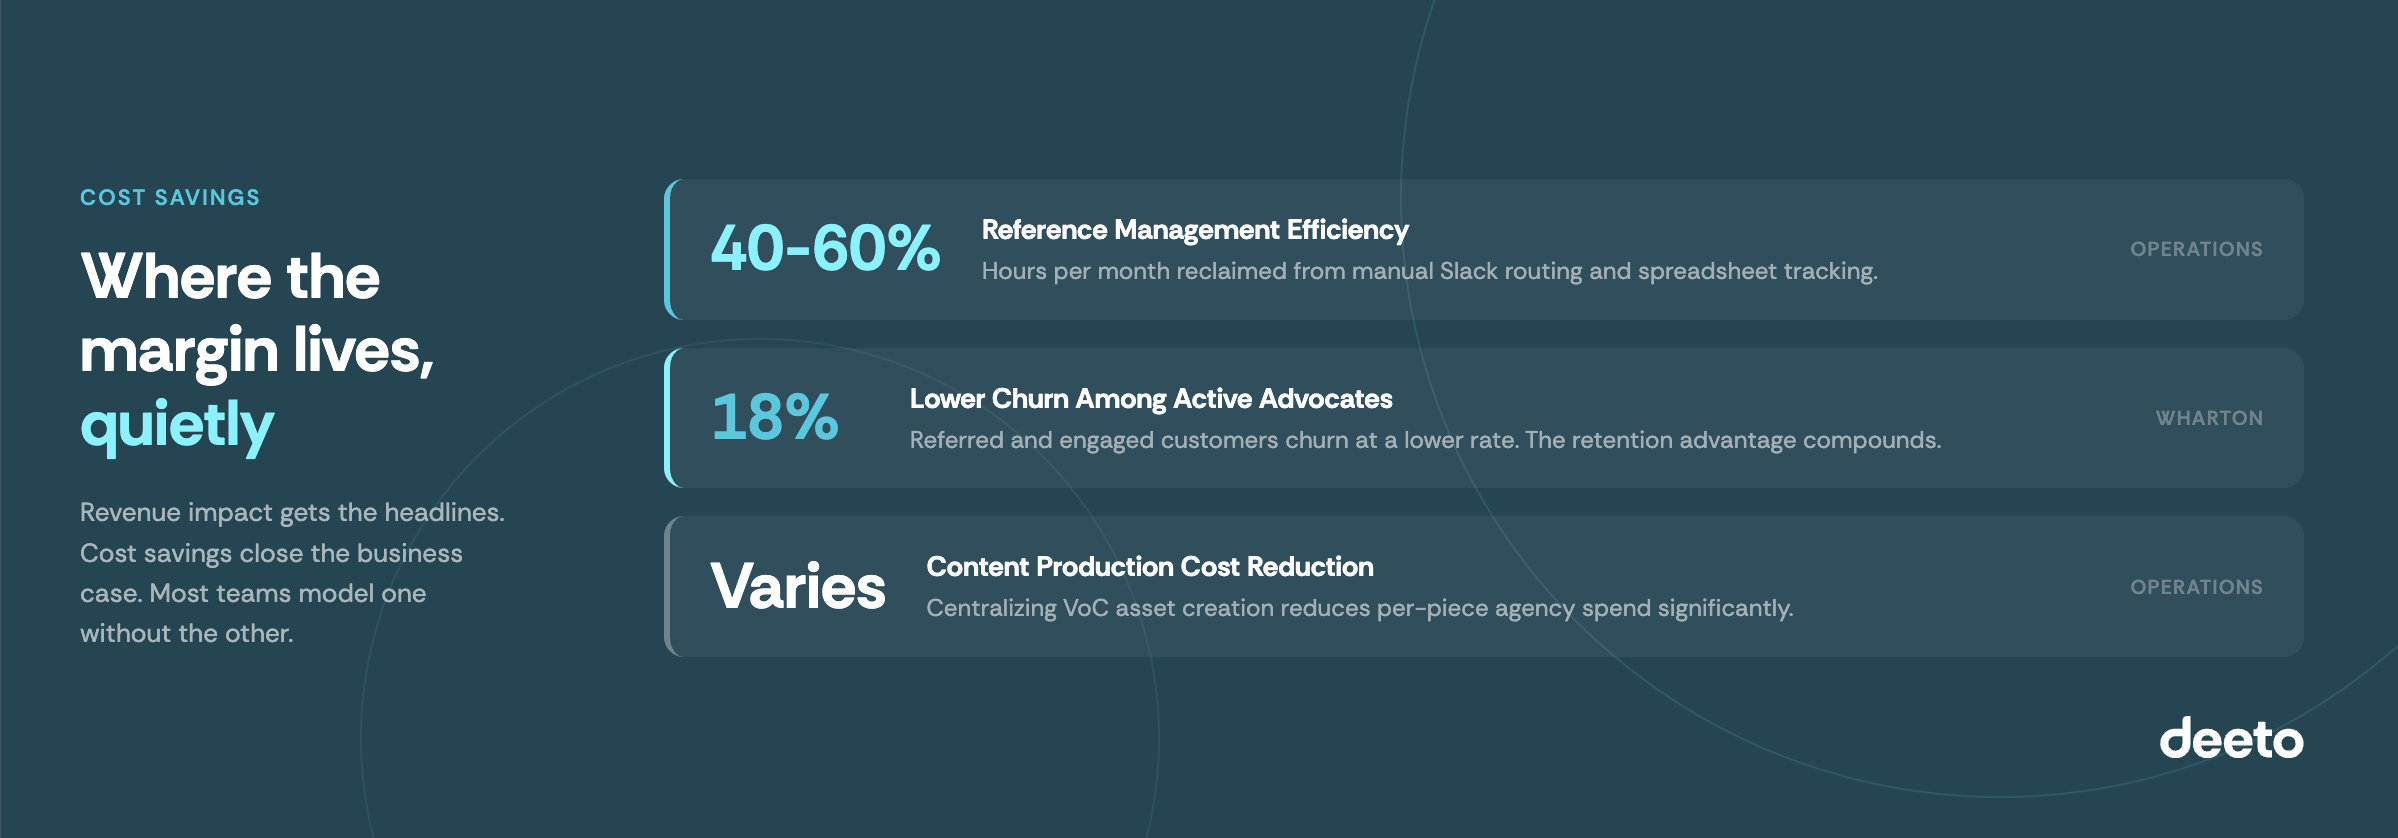
Revenue impact is the bigger number, but cost savings are often faster to prove internally and easier to tie to headcount.
Reference Management Efficiency
Manual reference coordination including spreadsheets, Slack routing, and back-and-forth matching is expensive. Teams that handle it manually typically spend 20–40 hours per month on tasks a centralized system handles in minutes. Calculate: monthly hours x loaded hourly cost x 12. Then model a 40–60% reduction.
Content Production Cost Reduction
If your team buys case studies or VoC research from agencies, centralizing that work reduces per-piece cost significantly. Calculate: annual assets produced x agency cost per piece, then model the reduction from bringing production in-house at scale.
Churn Reduction
The retention effect of an active advocacy program is well documented. The Wharton study on referred customers found they churned at an 18% lower rate than non-referred customers, and unlike other value metrics, that retention advantage did not erode over time. The mechanism is straightforward: customers who are actively engaged with your program have more touchpoints, surface dissatisfaction earlier, and have a stronger relationship with the product than customers who go dark after onboarding. For a program with meaningful ARR at risk, this is often the largest cost savings line in the model.
What the Numbers Actually Look Like: An Example from Deeto's ROI Calculator
Deeto's ROI calculator lets you input your real business parameters including deal volume, average deal size, win rate, sales cycle length, churn rate, and program costs, to model projected impact across every category above.
For a mid-market SaaS company running 150 deals per year at a $60,000 average deal size, with a 25% win rate and a 90-day sales cycle, the calculator typically surfaces:
- Win rate improvement (15%): ~$338,000 in additional annual revenue
- Sales cycle reduction (20%): significant deal capacity gain modeled as additional closed revenue per rep
- MQL conversion lift (25%): incremental pipeline value from improved lead progression
- Churn reduction (10%): meaningful ARR protection depending on the customer base size
The output includes a projected ROI multiple, net annual value, months-to-payback, and a 3-year cumulative view that factors in compound adoption as the program matures.
You can adjust confidence levels for each category to model conservative, expected, and optimistic scenarios. This makes the output defensible in executive conversations because it shows range, not just a single number.
Run your numbers in Deeto's ROI Calculator
How Deeto Customers Are Proving This in Practice
The benchmark-based model above is a starting point. The teams getting the clearest ROI data are the ones using a platform that tracks it automatically by connecting customer voice activity to deal outcomes without manual reconciliation.
That's the problem Deeto is built to solve. By centralizing the capture of customer voice, organizing it into a live intelligence layer, and surfacing it in active workflows, Deeto gives teams the attribution data that most ROI models are missing.
Here's what that looks like from the teams using it.
Brendan Hong, who leads customer marketing at Agiloft, described the before state plainly: "Before Deeto, we were managing everything manually. Now we have a centralized system that scales with us."
Michele Teixeira at Datarails put it this way: "Before Deeto, our reference process was cumbersome and manual. We handled everything via Slack. Now the platform automates the entire workflow and gives us visibility we never had."
The visibility of knowing which references are being used, which content is influencing deals, and which advocates are engaged is what makes the ROI model live rather than theoretical.
Frank Provenzano at Boomi described the shift more directly: "Before Deeto, we dealt with too much information, no organization, and the amount of time that we needed to collect customer stories was overwhelming. Deeto changed all of that."
The operational savings those teams describe map directly to the cost savings inputs in your model. The deal-influence data Deeto surfaces maps to the revenue impact inputs. The model stops being an estimate and starts being a report.
What to Track Once the Program Is Running
A model is only as strong as the data feeding it. These are the metrics worth setting up from day one:
Deal influence rate: What percentage of closed-won deals involved customer evidence in some form. This is the single most important attribution metric in the program, and it lives in CRM.
Reference request fulfillment rate: How quickly and completely your team matches prospect requests to willing references. Slowdowns here signal advocate pool gaps before they become deal-level problems.
Content asset utilization: Which customer stories and testimonials are actually getting used in active sales cycles. Low utilization means the activation layer is breaking down somewhere.
Advocate engagement score: A composite of participation frequency, activity type, and responsiveness to outreach. Declining scores are early churn signals for your advocate base, not just your customer base.
Win-loss pattern changes: Are the competitive gaps that surface in win-loss research shrinking over time as messaging improves? This is the clearest evidence that your research function is generating ROI.
Common Mistakes That Undermine the Business Case
Modeling only Year 1. Voice of the customer programs compound. An advocate network built in Year 1 produces references, referrals, and content in Year 2 and Year 3 with decreasing marginal cost. A 3-year model captures this and typically makes the case two to three times stronger.
Leaving out cost savings. Teams that only model revenue impact are presenting half the picture. The combined number is always more compelling and more credible.
Not anchoring to named benchmarks. A projected number without a source is an opinion. A projected number without a source is just an opinion. Sources like Nielsen, TrustRadius, Wharton, and Sales Benchmark Index carry real weight in executive conversations. Use them.
Skipping the confidence range. Present conservative, expected, and optimistic scenarios. It signals rigor and makes the model harder to dismiss.
Key Takeaways
- Voice of the customer program ROI combines revenue impact (win rate, cycle length, MQL conversion, referrals, research lift) with cost savings (reference management, content production, churn reduction)
- The core formula is: (Total Value Generated - Program Cost) / Program Cost x 100
- Deeto's ROI calculator models your specific inputs against industry benchmarks and produces a defensible business case with 3-year projections
- Customer teams at Agiloft, Datarails, and Boomi describe the platform as the shift from manual chaos to measurable, scalable programs
- The teams that measure program ROI rigorously protect their budget and expand faster. The teams that rely on anecdotes don't
Conclusion
Most voice of the customer programs are delivering more value than their teams can prove. The gap isn't in results. It's in measurement.
Deeto is built to close that gap, from capturing authentic customer voice at scale, to organizing it for reuse, to surfacing it in the moments that move deals. The ROI calculator gives you a starting point for the business case before you even run a single campaign.
Start with the numbers: run your ROI calculation here. If you want to see how Deeto makes every input in that model trackable and automatic, book a demo.
Frequently Asked Questions
What is a good ROI for a voice of the customer program?
A well-run voice of the customer program typically delivers a 10–30x ROI multiple in Year 1, with the figure increasing as the advocate network matures and content assets compound. The specific number depends on deal volume, average deal size, and how deeply the program is integrated into sales and marketing workflows. Programs connected to CRM and surfaced in active sales enablement tools consistently see the highest return because utilization rates are higher and attribution is cleaner.
How long does it take to see ROI from a voice of the customer program?
Most programs show measurable impact within 2–4 months in reference management efficiency and early deal influence. Win rate lift and referral conversion typically take 6–9 months to appear as deal cycles complete. Research-driven improvements from win-loss analysis often show up within 3–6 months as messaging tightens and objection handling improves. Deeto's ROI calculator models months-to-payback based on your specific inputs.
What is the easiest ROI to prove for a voice of the customer program?
Reference management cost savings are typically the fastest to prove because they are direct and immediate. If your team currently spends 20+ hours per month on manual coordination at a known hourly cost, and a platform reduces that by 50–60%, the calculation requires no assumptions. Revenue impact is larger but requires CRM tracking and a longer measurement window to attribute correctly.
How does Deeto help teams measure customer voice ROI?
Deeto centralizes customer voice capture, organization, and activation in one platform, which means deal influence, content utilization, and advocate engagement data all live in the same system rather than across spreadsheets and Slack threads. Teams using Deeto replace manual reconciliation with automatic attribution, turning the ROI model from a quarterly estimate into a live dashboard.
What data do I need to build a customer voice ROI model?
At minimum: annual deal volume, average deal size, current win rate, current sales cycle length, monthly MQL volume, MQL-to-SQL conversion rate, active advocate count, monthly reference management hours, loaded hourly cost, annual content production spend, and annual churn rate. Deeto's ROI calculator walks you through each input and contextualizes your outputs against industry research.
How does customer advocacy affect churn?
Engaged advocates churn 26% less than non-advocates, according to Influitive research. Referred customers show 37% higher retention, per Wharton data. The mechanism is consistent engagement: advocates who regularly participate in program activities surface dissatisfaction earlier, deepen their relationship with the product, and have more touchpoints with the vendor team than passive customers. For programs with meaningful ARR at risk, churn reduction is often the largest single cost savings input in the ROI model.
🎉 Save your spot
Register for the event
Once your spot is secured, we’ll send your confirmation details.
Subscribe to our newsletter
Subscribe to receive the latest blog posts to your inbox every week.
By subscribing, you agree to our Privacy Policy
Subscribe to our newsletter
Get the latest news and updates from our team.
By subscribing, you agree to our Privacy Policy
Related posts

How to Choose a Customer Intelligence Platform
Evaluating customer intelligence platforms? Learn how to pick the right one.

Brand Advocacy Programs: What They Are and How to Build One That Works
What are brand advocacy programs? Learn what they are, how they work, and what separates the ones that drive results.

Best AI tools for customer engagement in 2026
Exploring AI customer engagement tools? Compare top platforms for voice capture, sentiment analysis, and customer proof.